
EA Mental Health Exploratory Plots
The Code to produce them, in R, was:
# EA Mental Health - Clean
# Dependencies:
# install.packages("tidyr")
# install.packages("scales")
# install.packages("tidyverse")
# install.packages("viridisLite")
# install.packages("viridis")
# install.packages("magrittr")
library(stringi)
library(magrittr)
library(tidyr)
library(scales)
library(tidyverse)
library(viridisLite)
library(viridis)
library(forcats)
# Set your working directory to where the data is:
setwd("directory")
A <- read.csv("Responses.csv", header=TRUE, sep=",", stringsAsFactors = FALSE)
## Note: if you don't select stringsAsFactors = FALSE, you can't manipulate elements as strings (for example, with grepl) unless you first process your data. For example: as.character(A[,column of interest]) -> A[,column of interest]
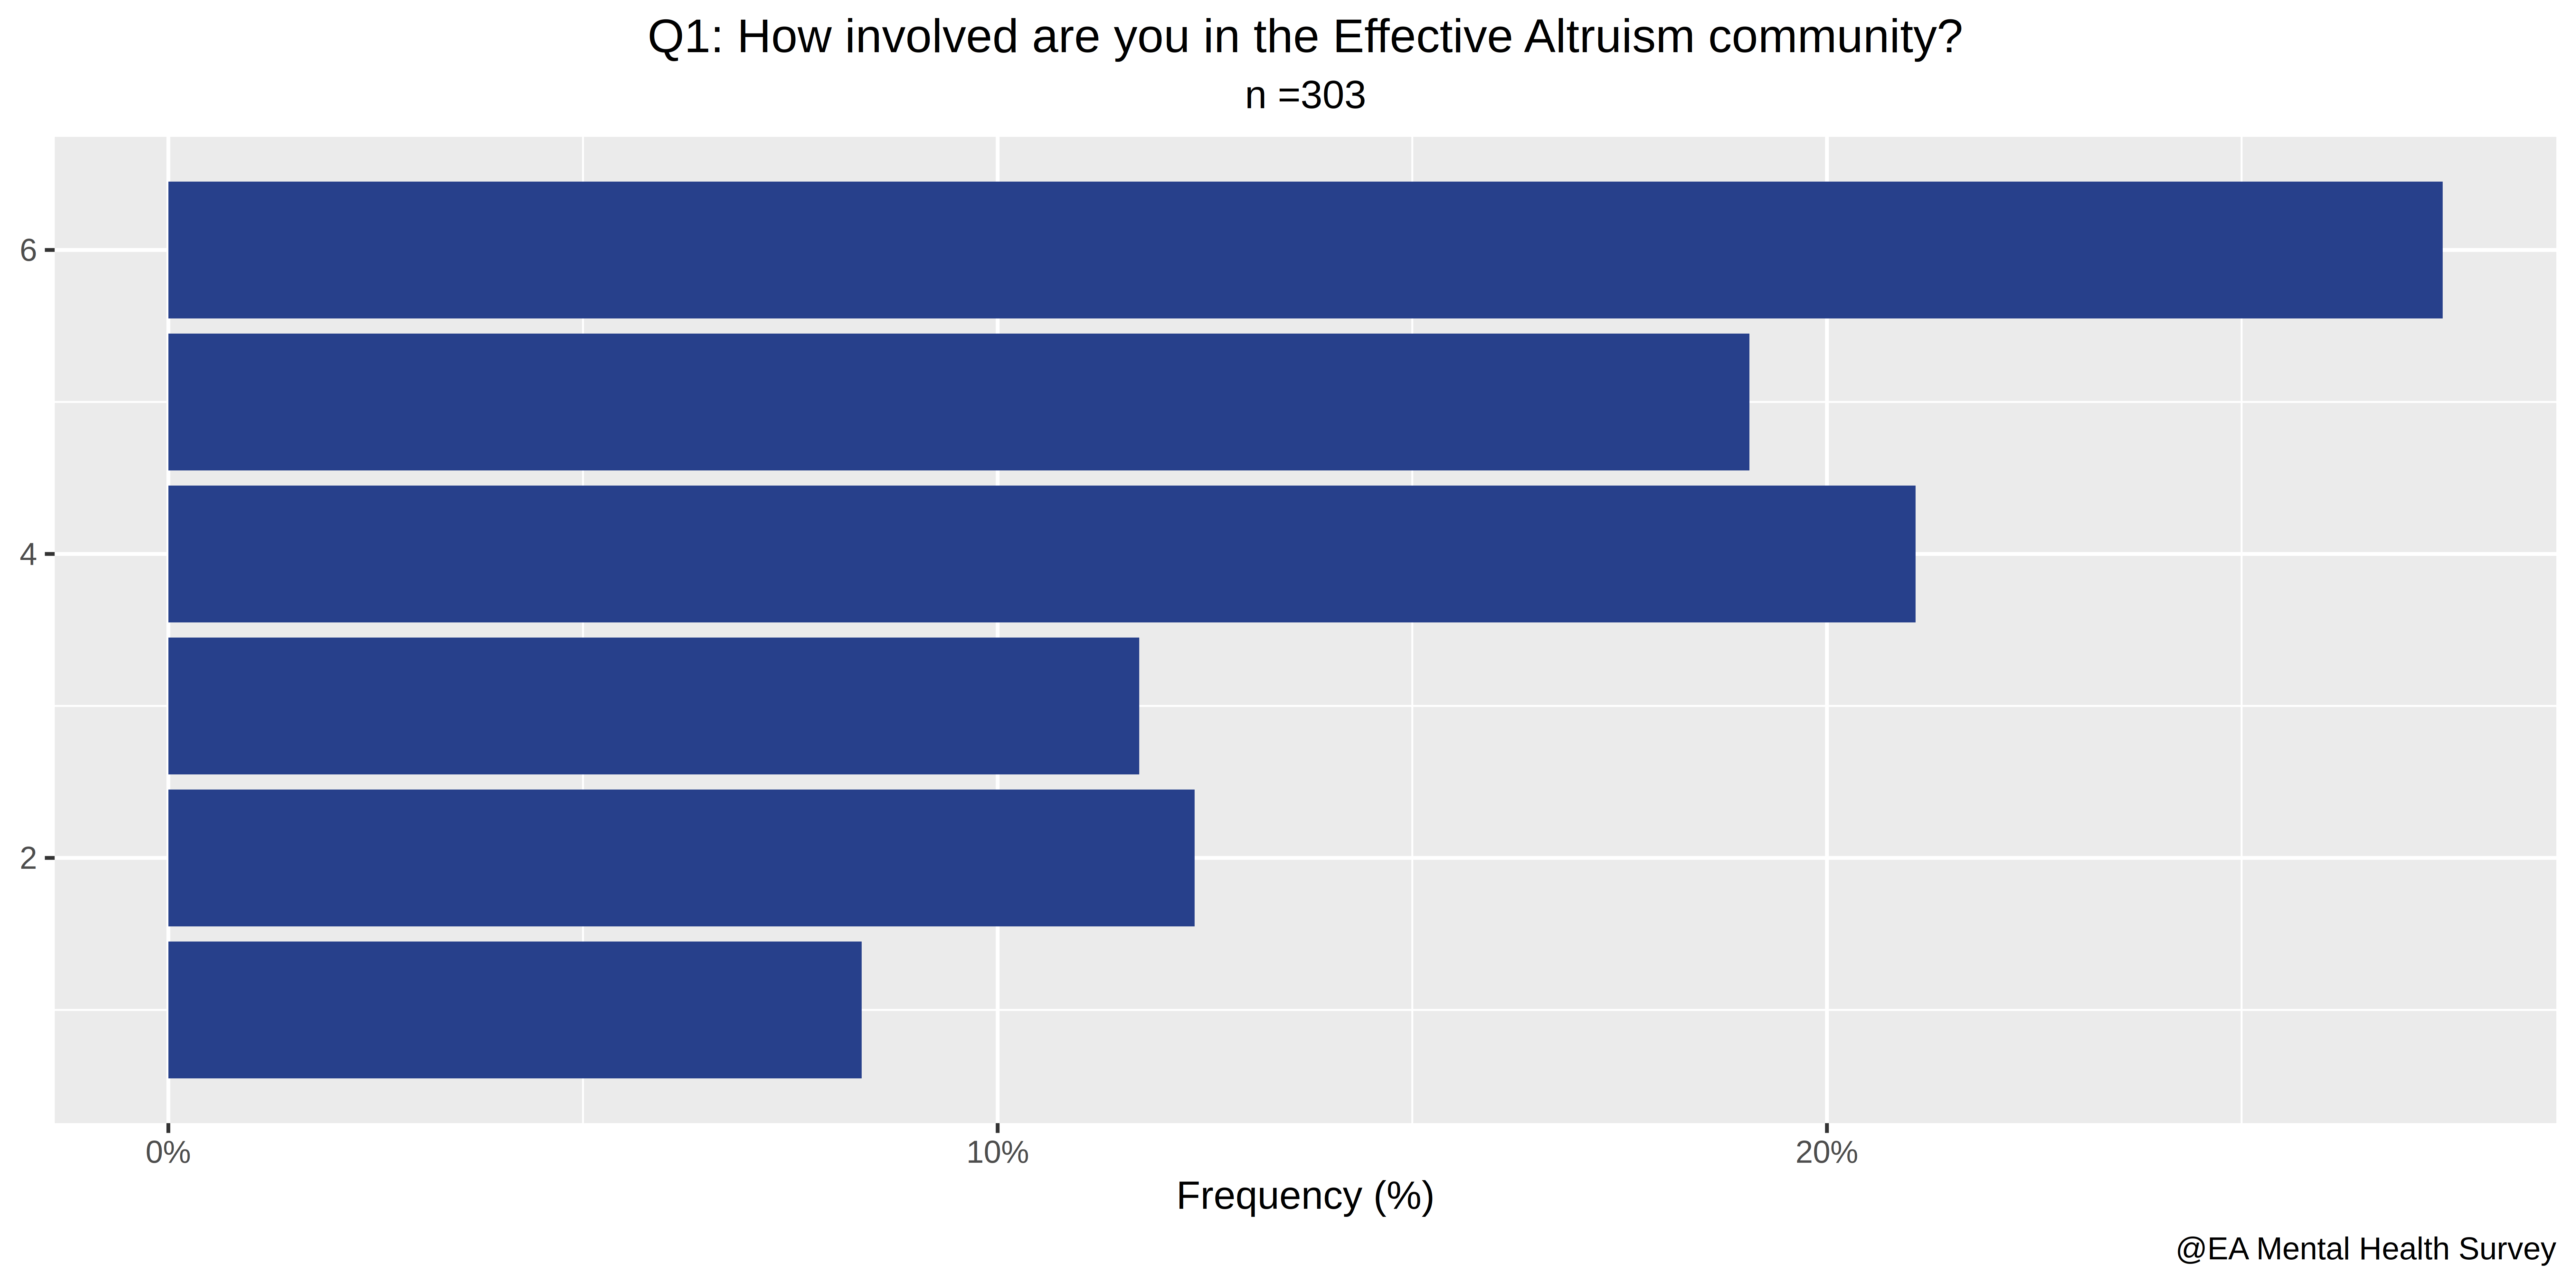
# Q1:How involved are you with the effective altruism community
colnames(A)[3]
(ggplot(data = A, aes(x = How.involved.are.you.in.the.Effective.Altruism.Community.)) +
geom_bar(
aes(y = (..count..)/sum(..count..)),
fill="royalblue4"
)+
labs(
title="Q1: How involved are you in the Effective Altruism community?",
subtitle="n =303",
x=NULL,
y="Frequency (%)",
caption="@EA Mental Health Survey"
)+
scale_y_continuous(
labels = percent_format(accuracy = 1)
)+
coord_flip()+
theme(
legend.title = element_blank(),
plot.subtitle = element_text(hjust = 0.5),
plot.title = element_text(hjust = 0.5),
legend.position="bottom")
) %>%
ggsave("Q1.png", plot =., units="in", width=10, height=5, dpi=800)
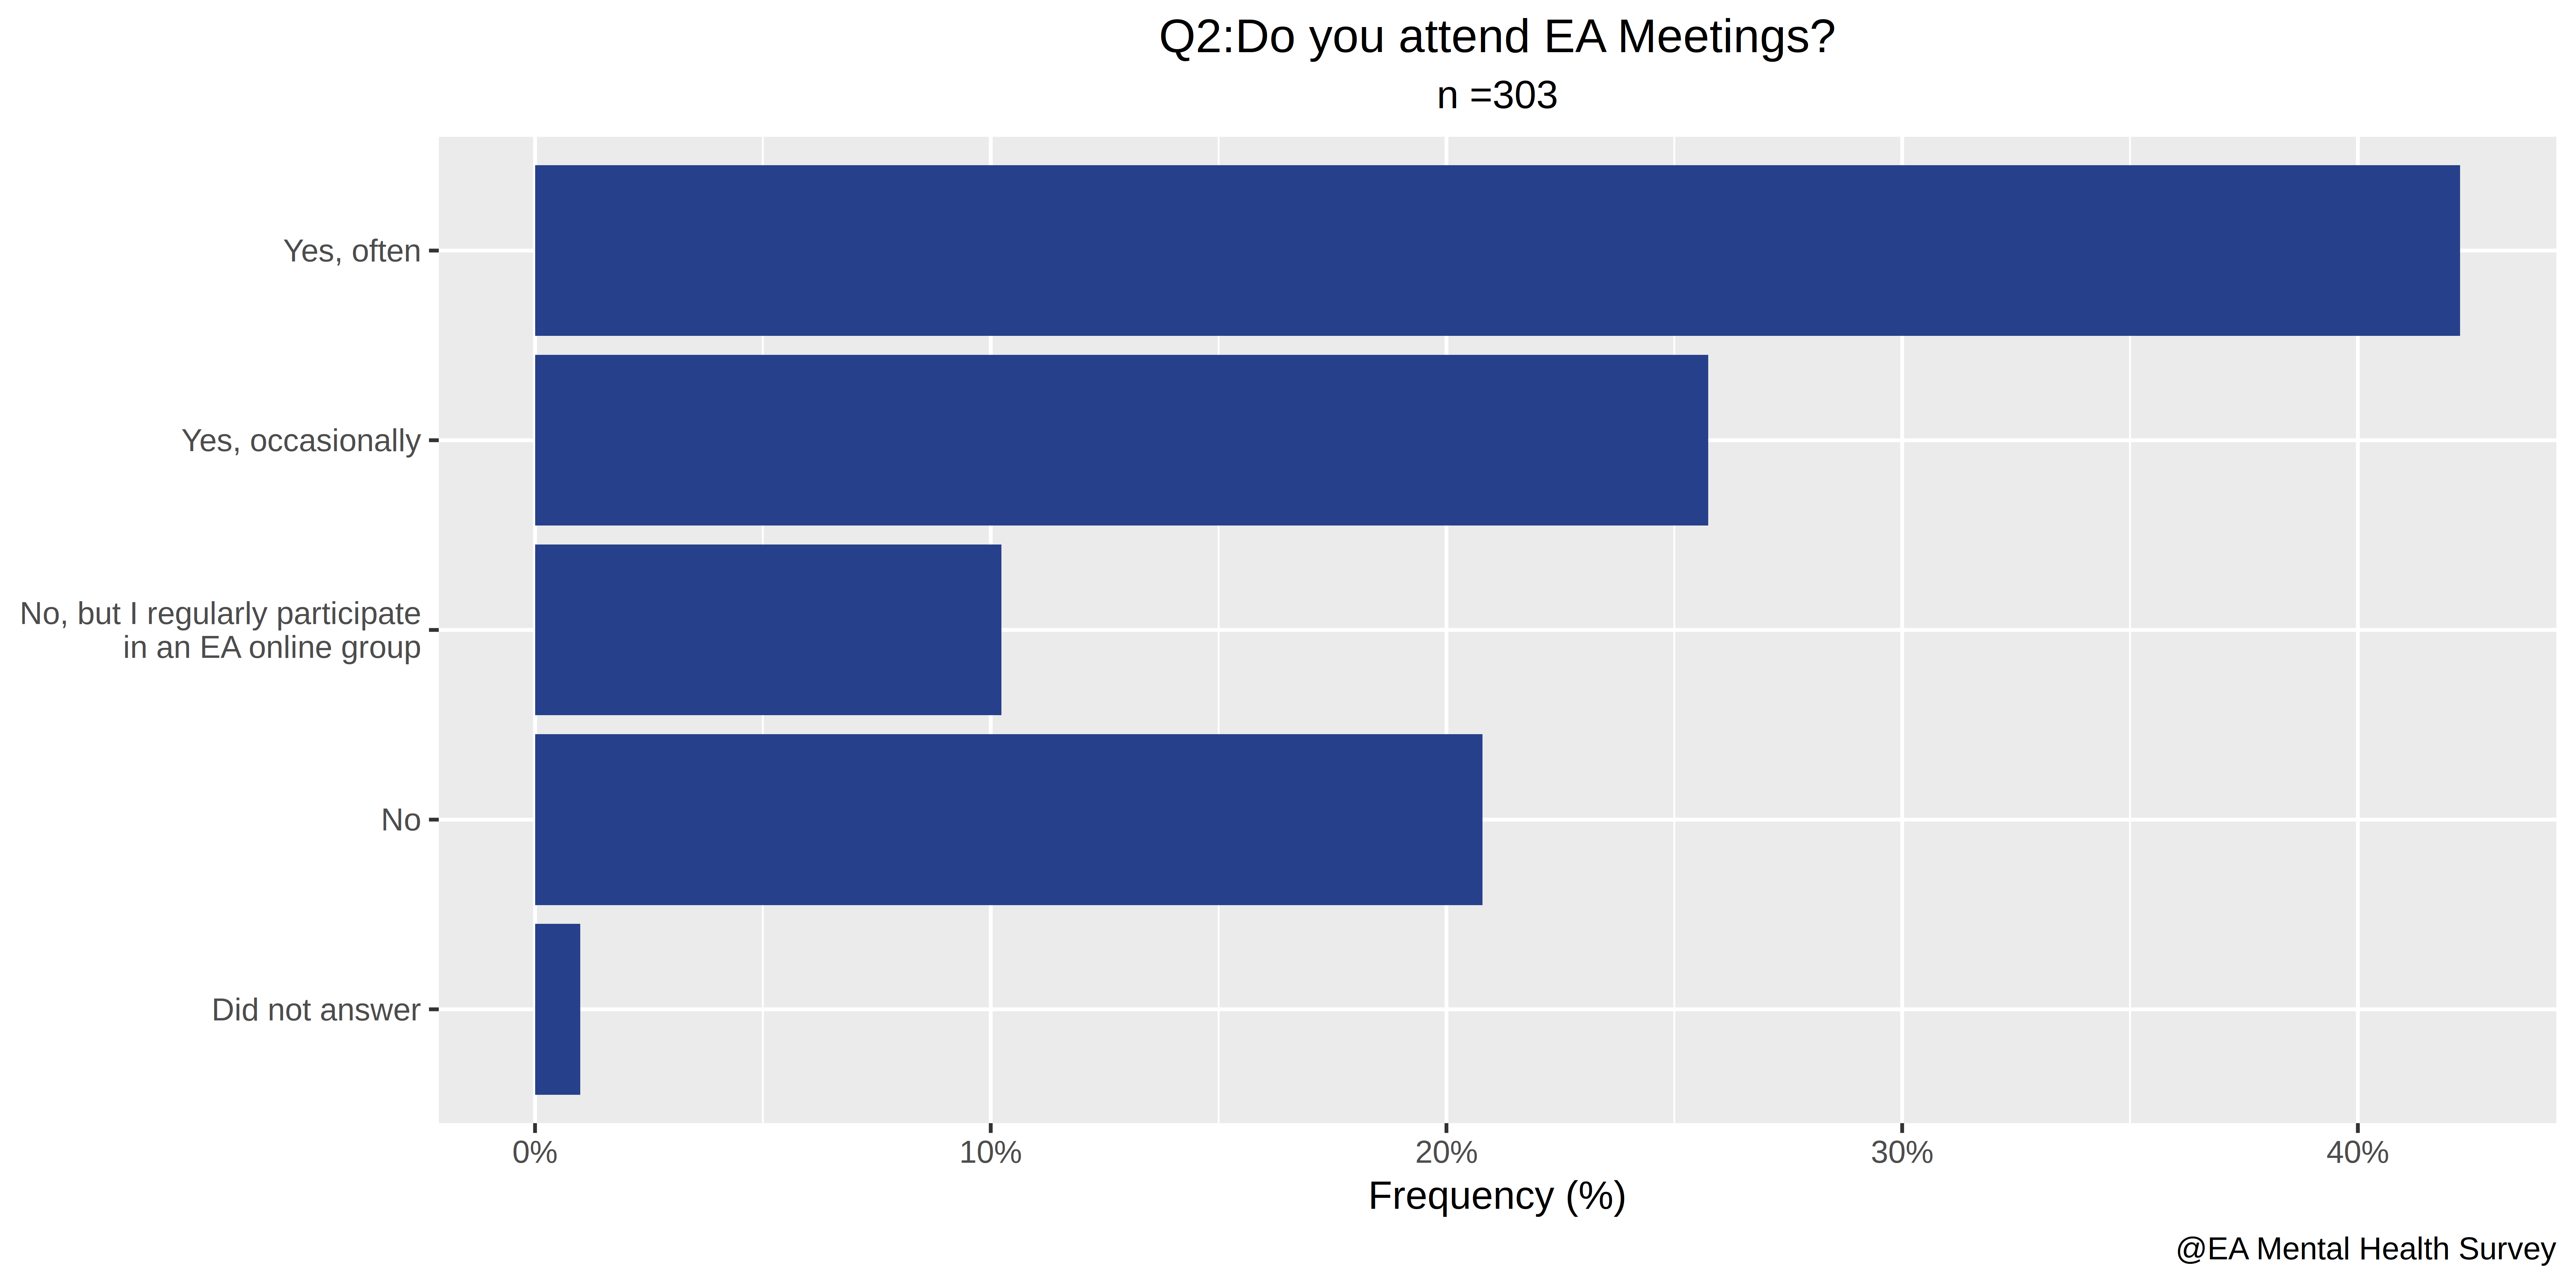
## Q2: Do you attend EA Meetings
colnames(A)[4]
### This adds a line:
for( i in c(1:length(A[,4]))){
if(A[,4][i]=="No, but I regularly participate in an EA online group"){
A[,4][i] = "No, but I regularly participate\n in an EA online group"
}
}
ifelse(A[,4]=="", "Did not answer", A[,4]) -> A[,4]
(ggplot(data = A, aes(x = Do.you.attend.EA.meetings.)) +
geom_bar(
aes(
y = (..count..)/sum(..count..)),
fill="royalblue4"
)+
coord_flip()+
labs(
title="Q2:Do you attend EA Meetings?",
subtitle="n =303",
x=NULL,
y="Frequency (%)",
caption="@EA Mental Health Survey"
)+
scale_y_continuous(
labels = percent_format(accuracy = 1)
)+
theme(
legend.title = element_blank(),
plot.subtitle = element_text(hjust = 0.5),
plot.title = element_text(hjust = 0.5),
legend.position="bottom")
) %>%
ggsave("Q2.png", plot =., units="in", width=10, height=5, dpi=800)
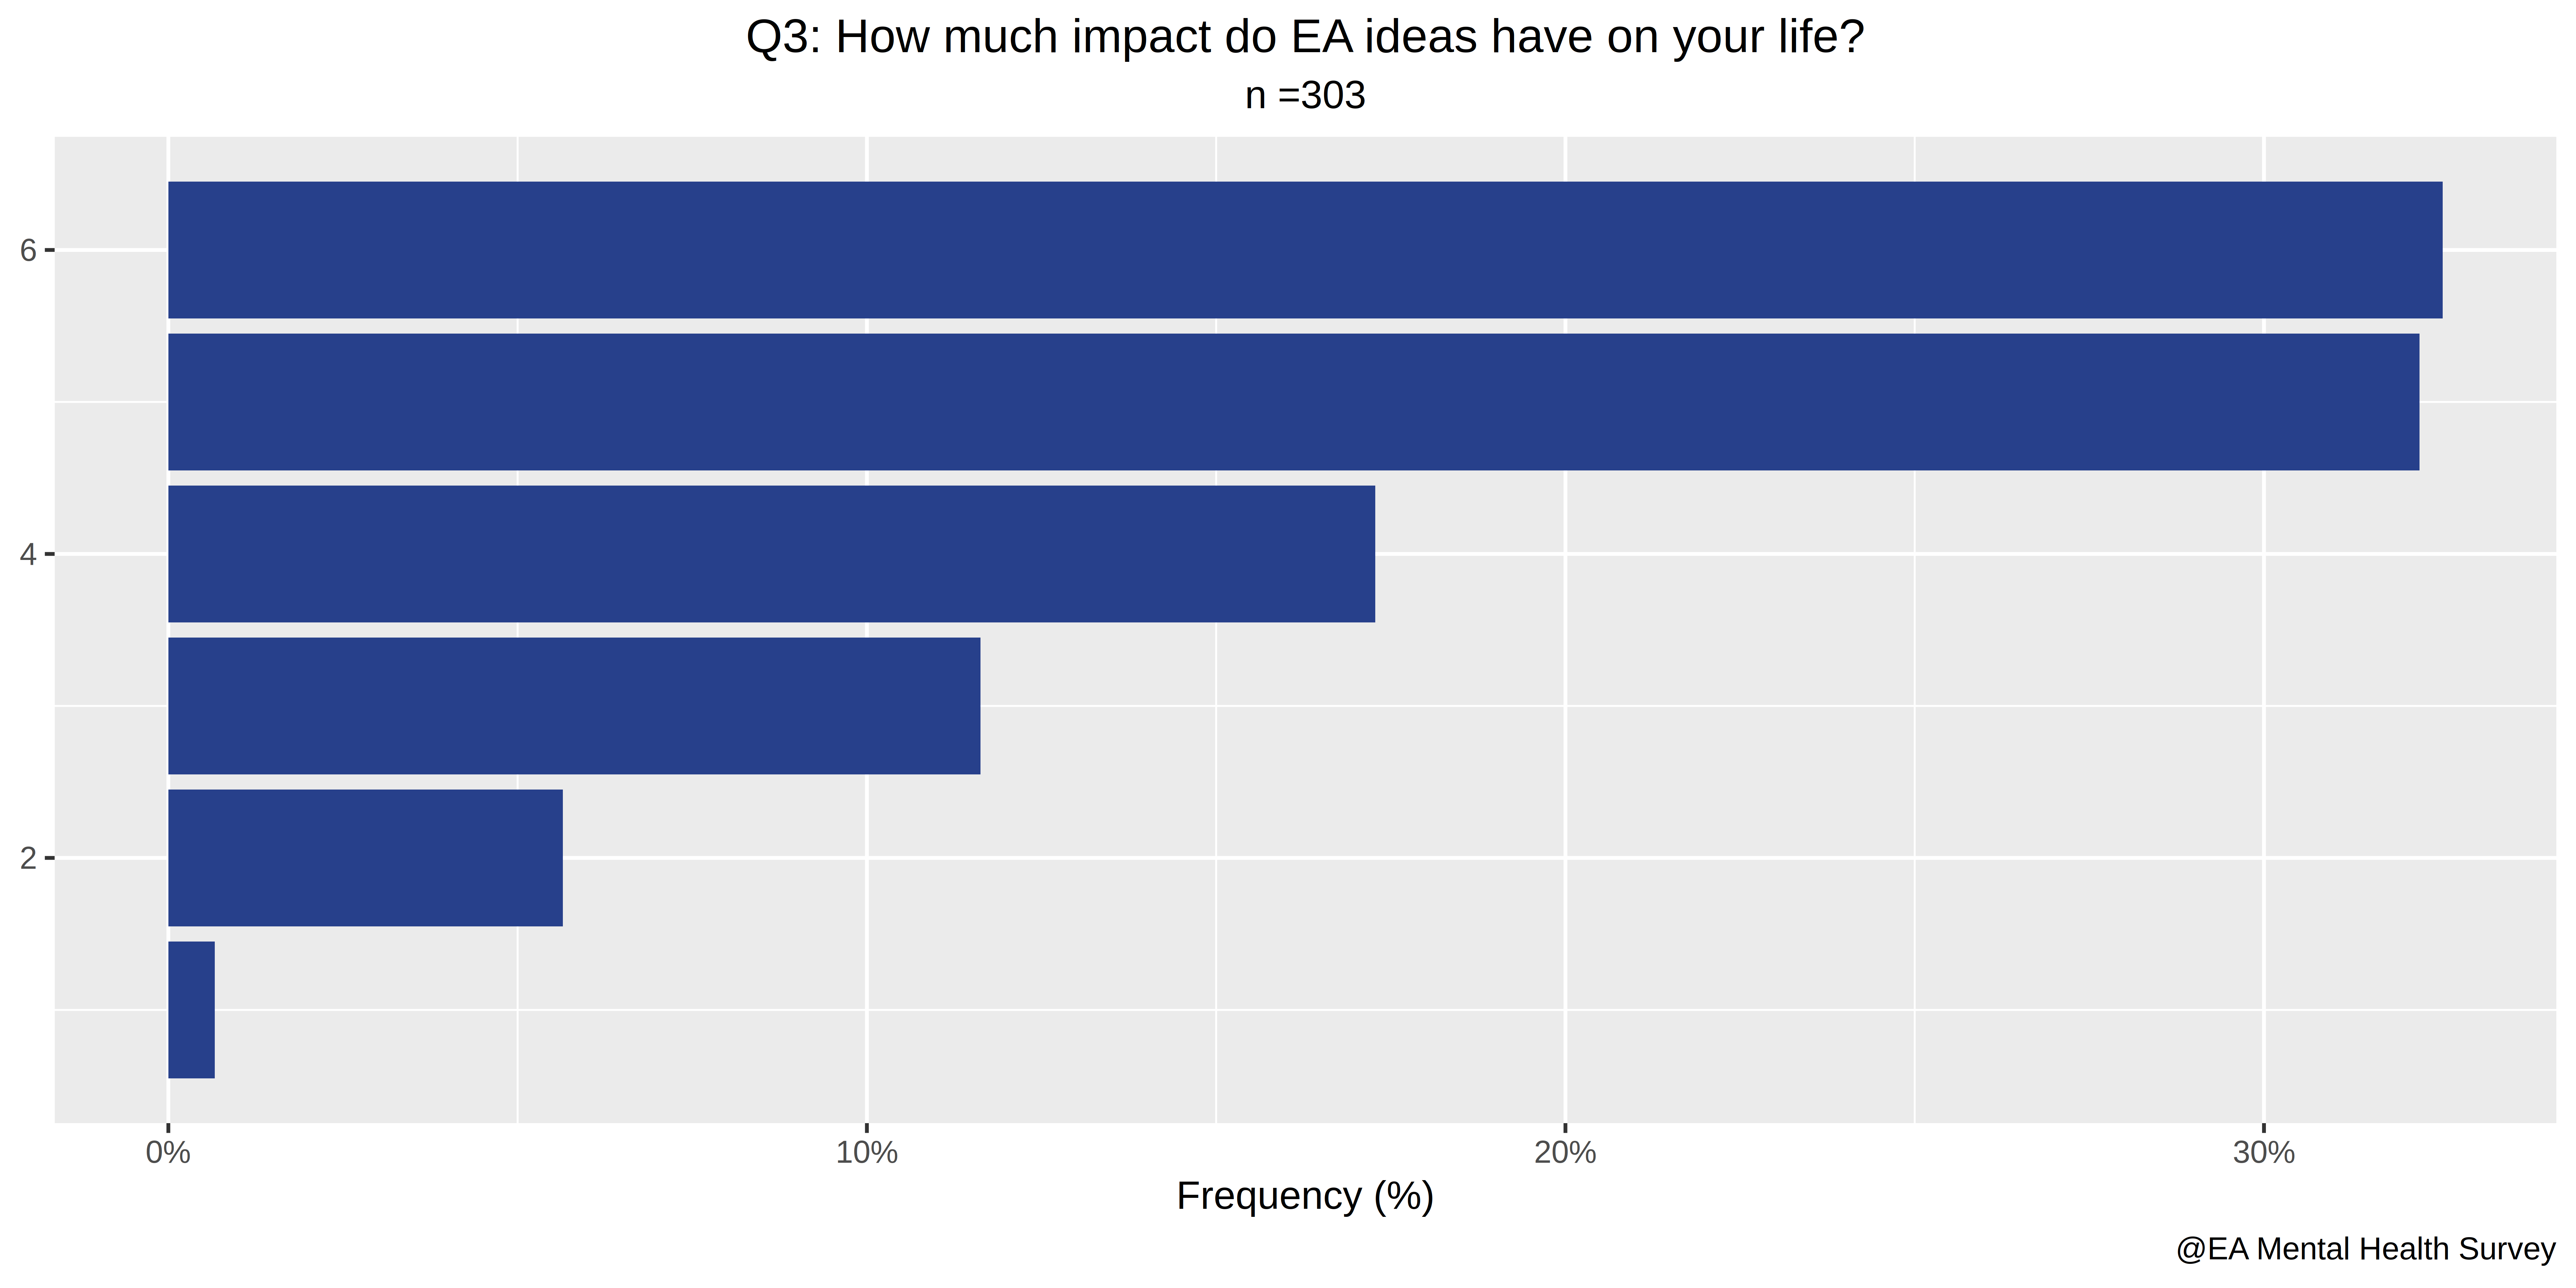
## Q3: How much impact do EA ideas have on your life
ini = 2
i=ini+3
colnames(A)[i] %>%
gsub("\\."," ",.) %>%
c("Q",i-ini,": ",.,"?") %>%
paste(., collapse="") %>%
gsub(" \\?","?",.) -> titulo
ifelse(A[,i]=="", "Did not answer", A[,i]) -> A[,i]
(ggplot(data = A, aes(x = get(colnames(A)[i]))) +
geom_bar(
aes(y = (..count..)/sum(..count..)),
fill="royalblue4")+
coord_flip()+
labs(
title=titulo,
subtitle="n =303",
x=NULL,
y="Frequency (%)",
caption="@EA Mental Health Survey"
)+
scale_y_continuous(
labels = percent_format(accuracy = 1)
)+
theme(legend.title = element_blank(), plot.subtitle = element_text(hjust = 0.5), plot.title = element_text(hjust = 0.5),legend.position="bottom")
) %>%
ggsave("Q3.png", plot =., units="in", width=10, height=5, dpi=800)
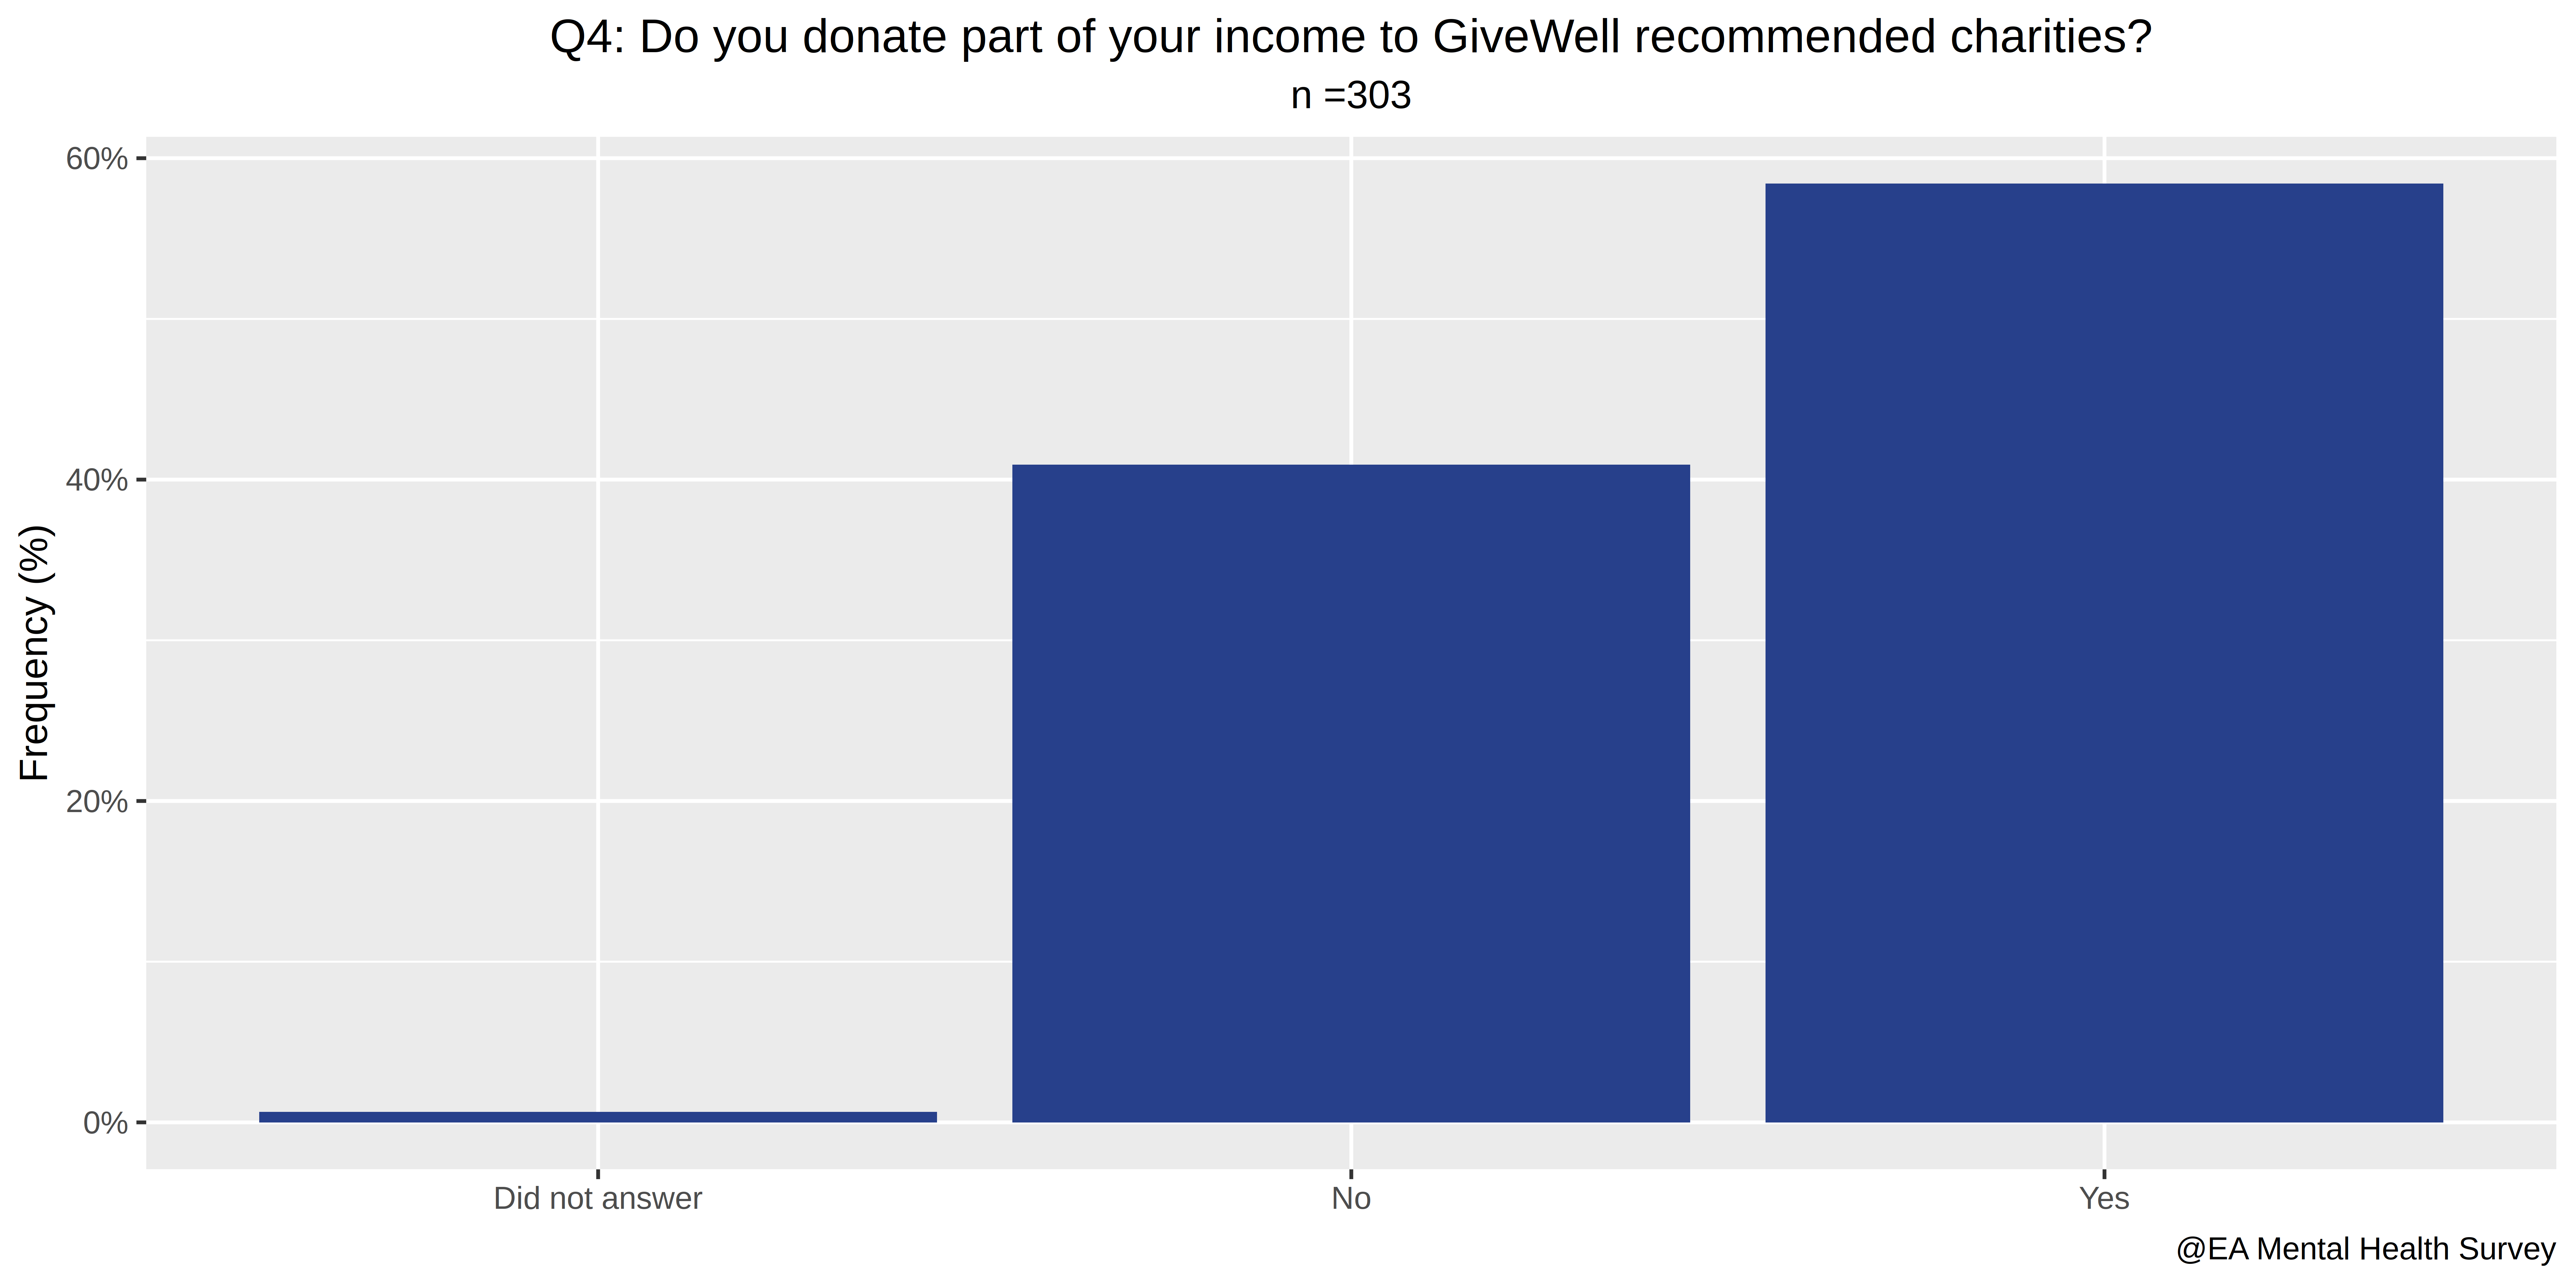
## Q4: Do you donate part of your income to GiveWell recommended charities?
ini = 2
i=ini+4
colnames(A)[i] %>%
gsub("\\."," ",.) %>%
c("Q",i-ini,": ",.,"?") %>%
paste(., collapse="") %>%
gsub(" \\?","?",.) -> titulo
ifelse(A[,i]=="", "Did not answer", A[,i]) -> A[,i]
(ggplot(data = A, aes(x = get(colnames(A)[i]))) +
geom_bar(
aes(y = (..count..)/sum(..count..)),
fill="royalblue4"
)+
labs(
title=titulo,
subtitle="n =303",
x=NULL,
y="Frequency (%)",
caption="@EA Mental Health Survey"
)+
scale_y_continuous(
labels = percent_format(accuracy = 1)
)+
theme(
legend.title = element_blank(),
plot.subtitle = element_text(hjust = 0.5),
plot.title = element_text(hjust = 0.5),
legend.position="bottom"
)
)%>%
ggsave("Q4.png", plot =., units="in", width=10, height=5, dpi=800)
## I just discovered piping! Elegant!
## Q5: Which of these conditions have you been formally diagnosed with?
i=ini+5
colnames(A)[i] %>%
gsub("\\."," ",.) %>%
c("Q",i-ini,": ",.,"?") %>%
paste(., collapse="") %>%
gsub(" \\?","?",.) -> titulo
### This question will require some processing:
List_of_Mental_Illnesses = c("Depression","Anxiety", "Obsessive Compulsive Disorder", "Disordered Eating", "Alcoholism", "Drug Addiction", "Borderline Personality Disorder", "Bipolar Disorder", "Autism", "ADHD", "Schizophrenia")
MI=list()
for( j in List_of_Mental_Illnesses){
MI$count = c(MI$count,
sum(
grepl(j, A[,i])
)
)
MI$type = c(MI$type, j)
}
MI$frequency = 100*MI$count / l
as.data.frame(MI) -> MI
(ggplot(data = MI, aes(x =type, y = frequency)) +
geom_histogram(
stat="identity",
fill="royalblue4")+
scale_y_continuous(
labels=function(x) paste0(x,"%"),
limits = c(0, 33)
)+
scale_x_discrete(
limits=
List_of_Mental_Illnesses[
order(MI$count)# c(1,2,10,8,3,4,9,7,11,6,5) ## This orders the ilnesses by frequency
]
)+
coord_flip()+
labs(
title=titulo,
subtitle="n =303",
x=NULL,
y="Frequency (%)",
caption="@EA Mental Health Survey"
)+
theme(
legend.title = element_blank(),
plot.subtitle = element_text(hjust = 0.5),
plot.title = element_text(hjust = 0.5),
legend.position="bottom"
)
) %>%
ggsave("Q5.png", plot =., units="in", width=10, height=5, dpi=800)
## Q6: Which of these conditions do you think you may have but have never been formally diagnosed with?
## I guess we can just reuse the code from Q5
i=ini+6
colnames(A)[i] %>%
gsub("\\."," ",.) %>%
c("Q",i-ini,": ",.,"?") %>%
paste(., collapse="") %>%
gsub(" \\?","?",.) -> titulo
titulo= "Q6: Which of these conditions do you think you may have\nbut have never been formally diagnosed with?"
List_of_Mental_Illnesses = c("Depression","Anxiety", "Obsessive Compulsive Disorder", "Disordered Eating", "Alcoholism", "Drug Addiction", "Borderline Personality Disorder", "Bipolar Disorder", "Autism", "ADHD", "Schizophrenia")
MI2=list()
for( j in List_of_Mental_Illnesses){
MI2$count = c(MI2$count,
sum(
grepl(j, A[,i])
)
)
MI2$type = c(MI2$type, j)
}
MI2$frequency = 100*MI2$count / l
as.data.frame(MI2) -> MI2
(ggplot(data = MI2, aes(x =type, y = frequency)) +
geom_histogram(
stat="identity",
fill="royalblue4")+
scale_y_continuous(
labels=function(x) paste0(x,"%"),
limits = c(0, 33)
)+
scale_x_discrete(
limits=
List_of_Mental_Illnesses[
order(MI2$count)
#c(2,1,10,9,4,3,8,5,7,6,11) ## This orders the ilnesses by frequency
]
)+
coord_flip()+
labs(
title=titulo,
subtitle="n =303",
x=NULL,
y="Frequency (%)",
caption="@EA Mental Health Survey"
)+
theme(
legend.title = element_blank(),
plot.subtitle = element_text(hjust = 0.5),
plot.title = element_text(hjust = 0.5),
legend.position="bottom"
)
) %>%
ggsave("Q6.png", plot =., units="in", width=10, height=5, dpi=800)
## Q5 and Q6 together. Both (formally diagnosed or not) count.
i=ini+5
colnames(A)[i] %>%
gsub("\\."," ",.) %>%
c("Q",i-ini,": ",.,"?") %>%
paste(., collapse="") %>%
gsub(" \\?","?",.) -> titulo1
colnames(A)[i+1] %>%
gsub("\\."," ",.) %>%
c("Q",i-ini+1,": ",.,"?") %>%
paste(., collapse="") %>%
gsub(" \\?","?",.) -> titulo2
paste(c(titulo1, titulo2), collapse="\n+\n")-> titulo
MI$diagnosed = "Diagnosed"
MI2$diagnosed = "Intuited"
as.data.frame(rbind(MI, MI2)) -> MI3
(ggplot(data = MI3, aes(x =type, y = frequency, fill=diagnosed)) +
geom_histogram(
stat="identity",
position= position_stack(reverse = TRUE)
)+
scale_fill_manual(
values=c("royalblue3","steelblue1"))+
scale_x_discrete(
limits=
List_of_Mental_Illnesses[
order(MI$count +MI2$count ) ## This orders the ilnesses by frequency
]
)+
scale_y_continuous(
labels=function(x) paste0(x,"%"))+
coord_flip()+
labs(
title=titulo,
subtitle="n =303",
x=NULL,
y="Frequency (%)",
caption="@EA Mental Health Survey"
)+
theme(
legend.title = element_blank(),
plot.subtitle = element_text(hjust = 0.5),
plot.title = element_text(hjust = 0.5),
legend.position="bottom"
)
) %>%
ggsave("Q5and6.png", plot =., units="in", width=10, height=5, dpi=800)
## Q7: During the past 14 days how many hours did you miss from work because of mental health problems?
i=ini+7
read.csv("horus.csv", header=TRUE, sep=",", stringsAsFactors = FALSE) %>%
.[complete.cases(sapply(.,as.integer)),] %>%
.[order(as.integer(.$hours_worked)),] -> horus
horus$person2 = c(1:dim(horus)[1])
### We take the opportunity to calculate the average hours worked and missed.
colnames(horus)
mean(as.integer(horus$hours_worked))
# the mean is 59.58182 ~ 59.5 hours / 2 weeks
sd(as.integer(horus$hours_worked))
# 31.19616
mean(as.integer(horus$hours_missed_processed))
# 5.749091
sd(as.integer(horus$hours_missed_processed))
# 14.44113
mean(as.integer(horus$hours_missed_processed_other_reasons))
# 6.578182
sd(as.integer(horus$hours_missed_processed_other_reasons))
# 13.7492
### Problem: not everyone has answered each of the three questions, and the above only takes into account those who have. If we take into account
read.csv("horus.csv", header=TRUE, sep=",", stringsAsFactors = FALSE)-> horus2
mean(as.integer(horus2$hours_worked), na.rm=TRUE)
# the mean is 58.31707 ~ 58.3 hours / 2 weeks
sd(as.integer(horus2$hours_worked), na.rm=TRUE)
# 31.74407
mean(as.integer(horus2$hours_missed_processed), na.rm=TRUE)
# 6.190141
sd(as.integer(horus2$hours_missed_processed), na.rm=TRUE)
# 15.05628
mean(as.integer(horus2$hours_missed_processed_other_reasons), na.rm=TRUE)
# 6.758007
sd(as.integer(horus2$hours_missed_processed_other_reasons), na.rm=TRUE)
# 14.06154
### However, what we're interested in is in the ratio. The following plot ignores partial nonrespondents:
### We continue modifying the list further, to arrive at the plot we want
gather(horus,"type of hour", "hours", c(2:4)) -> horus
# Gather transforms:
# Person, hour_worked, hours_missed, hours_missed_non_mental ilness
#person hours_worked hours_missed_processed hours_missed_processed_other_reasons
#1 1 40 0 0
#> horus[c(1:10),]
#person hours_worked hours_missed_processed hours_missed_processed_other_reasons
#1 1 40 0 0
#2 2 80 0 0
#3 3 100 2 10
#4 4 80 0 0
## Into:
#person type of hour hours
#1 1 hours_worked 40
#2 2 hours_worked 80
#3 3 hours_worked 100
#4 4 hours_worked 80
#5 5 hours_worked 0
horus$hours = as.integer(horus$hours)
(ggplot(data = horus, aes(x =person2, y = hours, fill=get("type of hour"))) +
geom_histogram(stat="identity") +
scale_fill_viridis_d(
begin=1,
end=.2,
labels=
c(
" Work hours missed for mental health reasons",
" Work hours missed for other reasons",
" Total hours of work"
)
)+
labs(
title="Q7-9: Mental health and work hours",
subtitle="n =303",
x="Persons, ordered by hours worked",
y="Hours",
caption="@EA Mental Health Survey")+
theme(
legend.title = element_blank(),
plot.subtitle = element_text(hjust = 0.5),
plot.title = element_text(hjust = 0.5),
legend.position="bottom",
legend.direction = "vertical")
)%>%
ggsave("Q7-9c.png", plot =., units="in", width=12, height=8, dpi=800)
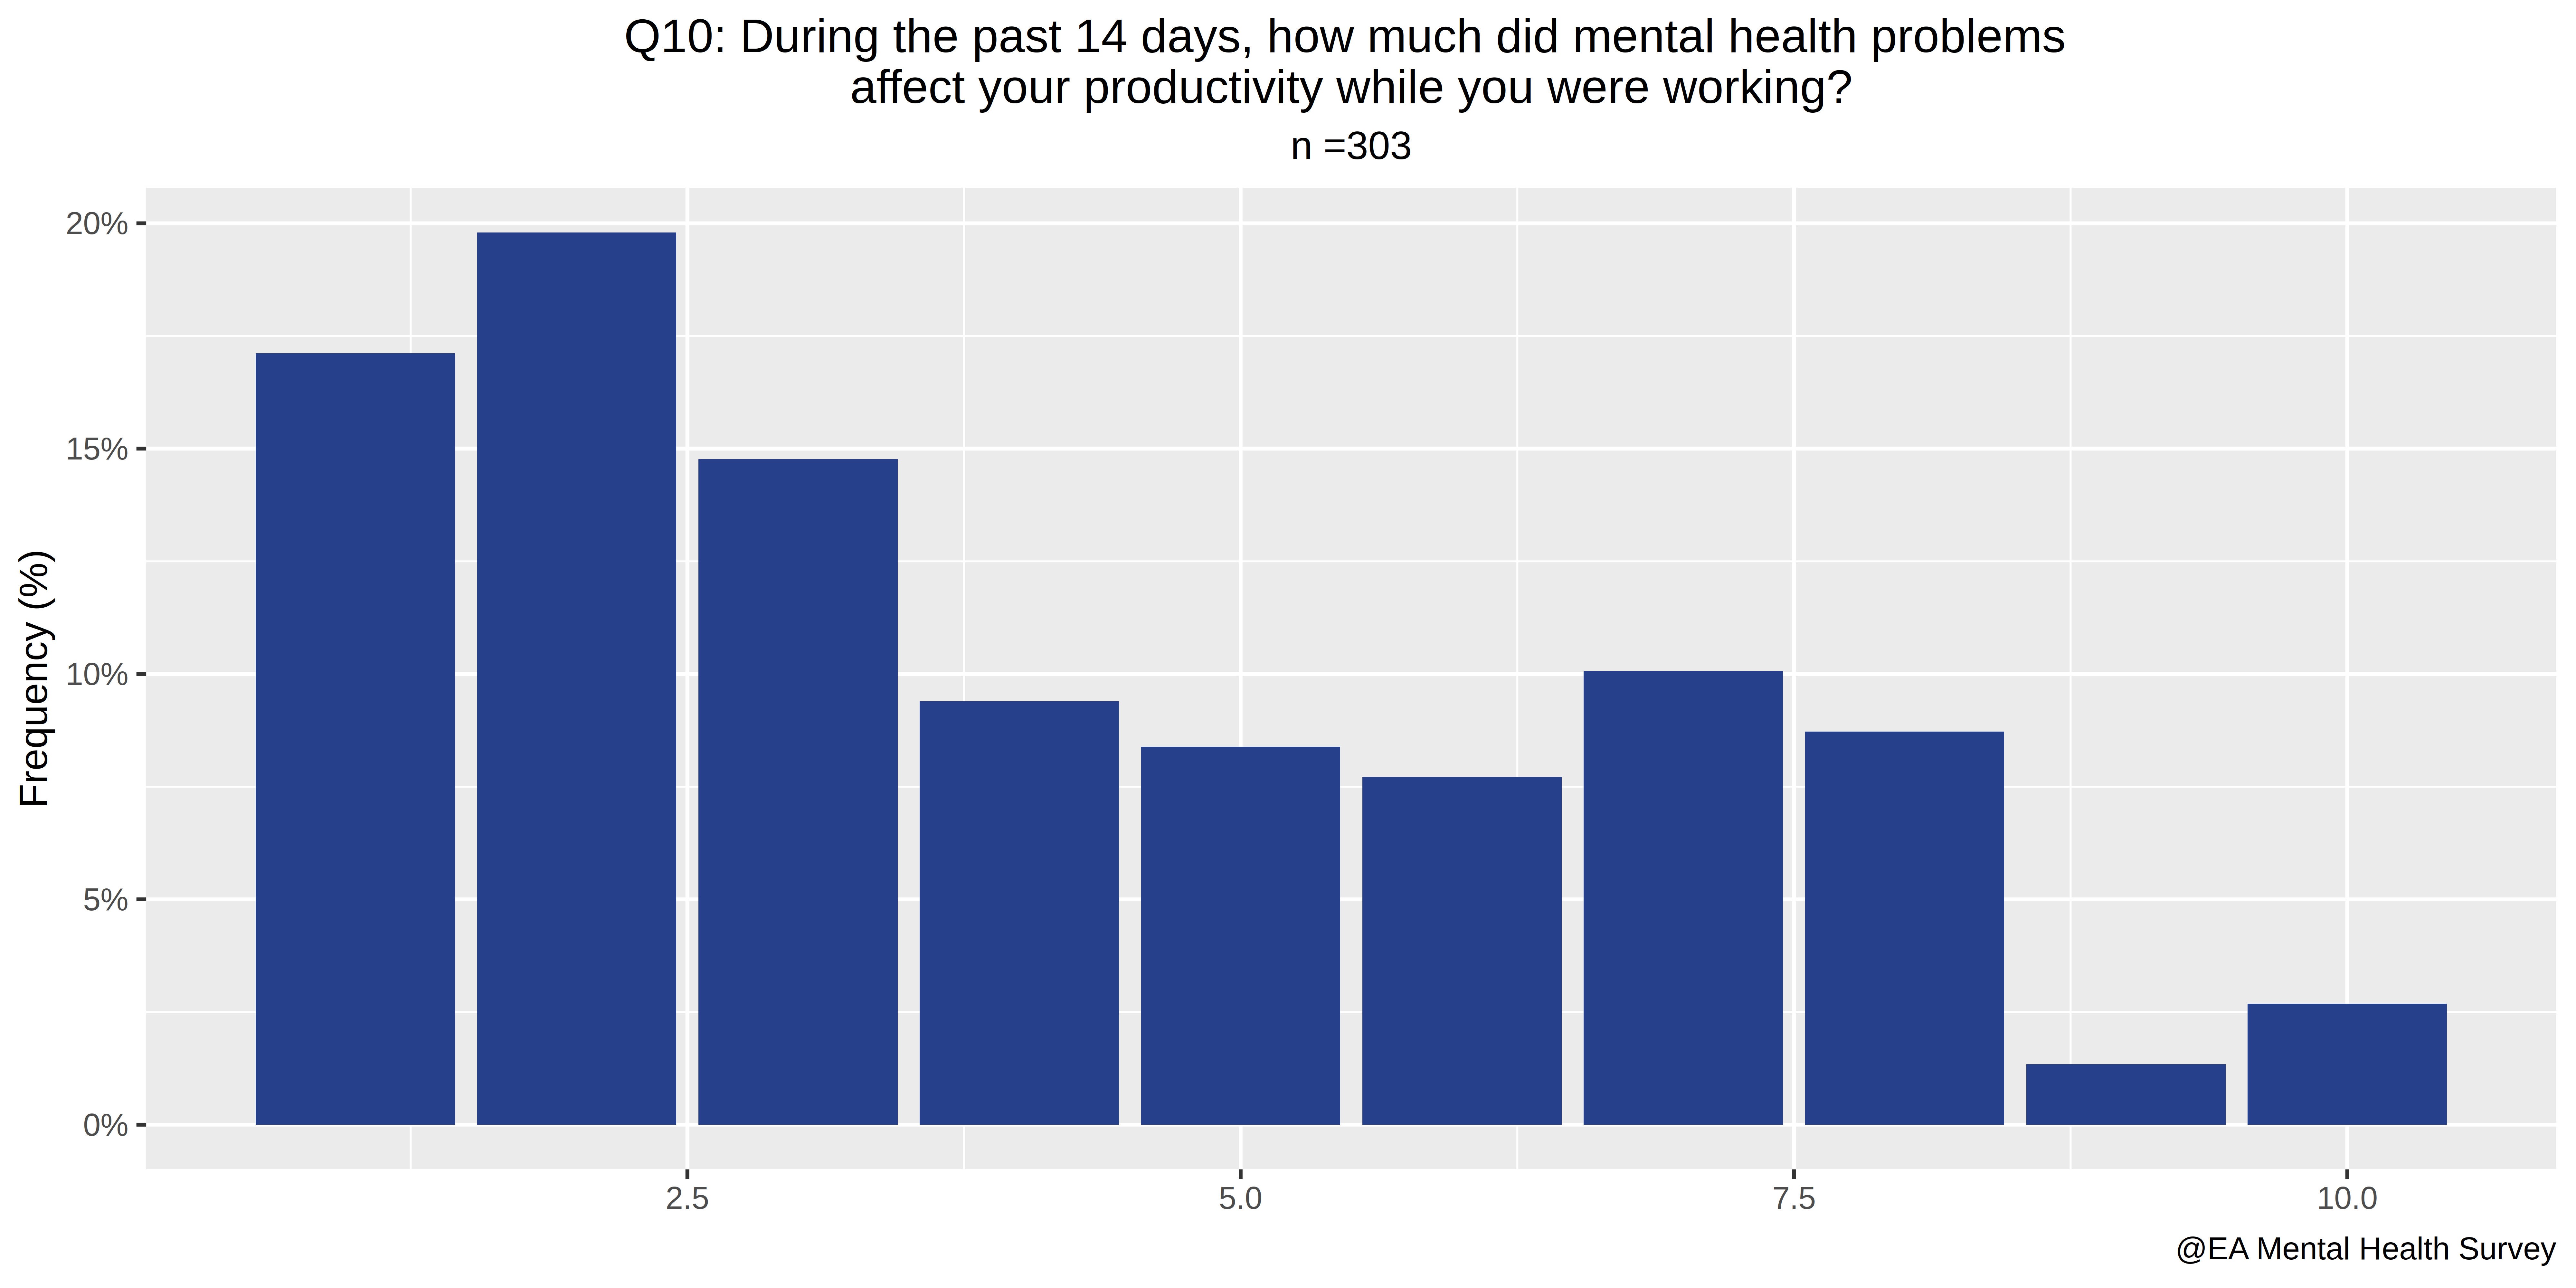
## Q10: During the past 14 days how much did mental health problems affect your productivity while you were working?
ini=2
i=ini+10
colnames(A)[i] %>%
gsub("\\."," ",.) %>%
c("Q",i-ini,": ",.,"?") %>%
paste(., collapse="") %>%
gsub(" \\?","?",.) -> titulo
titulo ="Q10: During the past 14 days, how much did mental health problems \naffect your productivity while you were working?"
(ggplot(data = A, aes(x = get(colnames(A)[i]))) +
geom_bar(
aes(y = (..count..)/sum(..count..)),
fill="royalblue4"
)+
labs(
title=titulo,
subtitle="n =303",
x=NULL, y="Frequency (%)",
caption="@EA Mental Health Survey"
)+
scale_y_continuous(
labels = percent_format(accuracy = 1)
)+
theme(
legend.title = element_blank(),
plot.subtitle = element_text(hjust = 0.5),
plot.title = element_text(hjust = 0.5),
legend.position="bottom")
)%>%
ggsave("Q10.png", plot =., units="in", width=10, height=5, dpi=800)
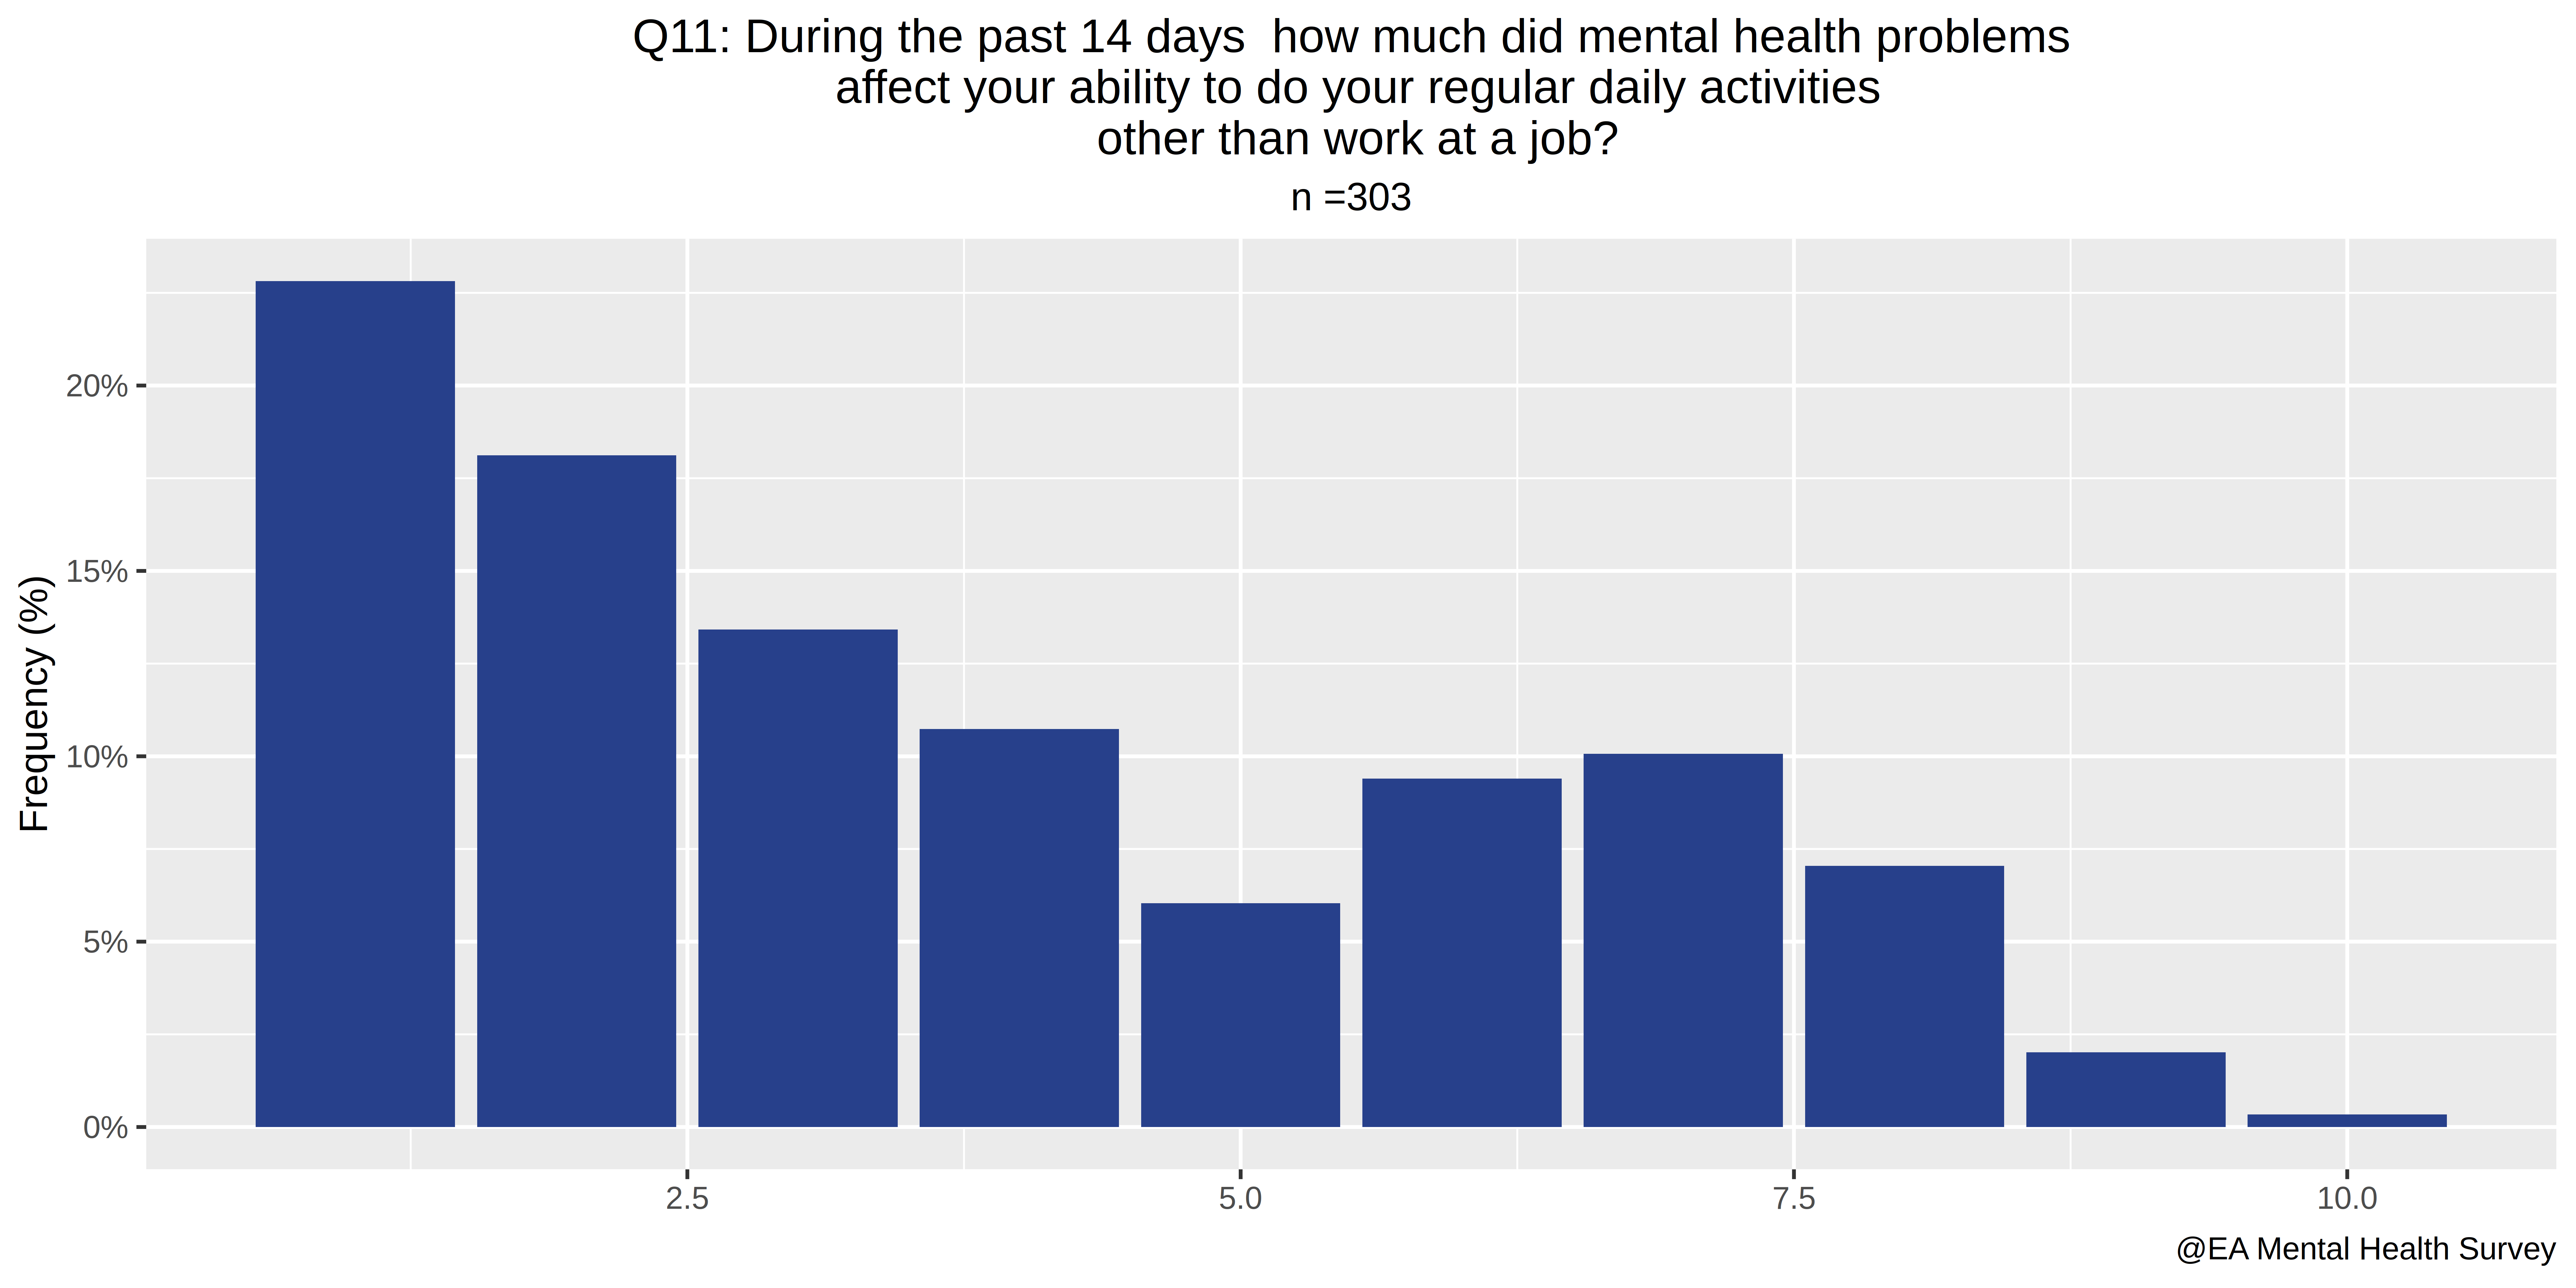
## [1] "Q11: During the past 14 days how much did mental health problems affect your ability to do your regular daily activities other than work at a job?"
ini = 2
i=ini+11
colnames(A)[i] %>%
gsub("\\."," ",.) %>%
c("Q",i-ini,": ",.,"?") %>%
paste(., collapse="") %>%
gsub(" "," ",.) %>%
gsub(" \\?","?",.) %>%
gsub(" \\?","?",.)-> titulo
titulo = "Q11: During the past 14 days, how much did mental health problems\n affect your ability to do your regular daily activities\n other than work at a job?"
(ggplot(data = A, aes(x = get(colnames(A)[i]))) +
geom_bar(aes(
y = (..count..)/sum(..count..)),
fill="royalblue4")+
labs(
title=titulo,
subtitle="n =303",
x=NULL, y="Frequency (%)",
caption="@EA Mental Health Survey"
)+
scale_y_continuous(
labels = percent_format(accuracy = 1)
)+
theme(
legend.title = element_blank(),
plot.subtitle = element_text(hjust = 0.5),
plot.title = element_text(hjust = 0.5),
legend.position="bottom")
)%>%
ggsave(paste(c("Q", i-ini,".png"), collapse=""), plot =., units="in", width=10, height=5, dpi=800)
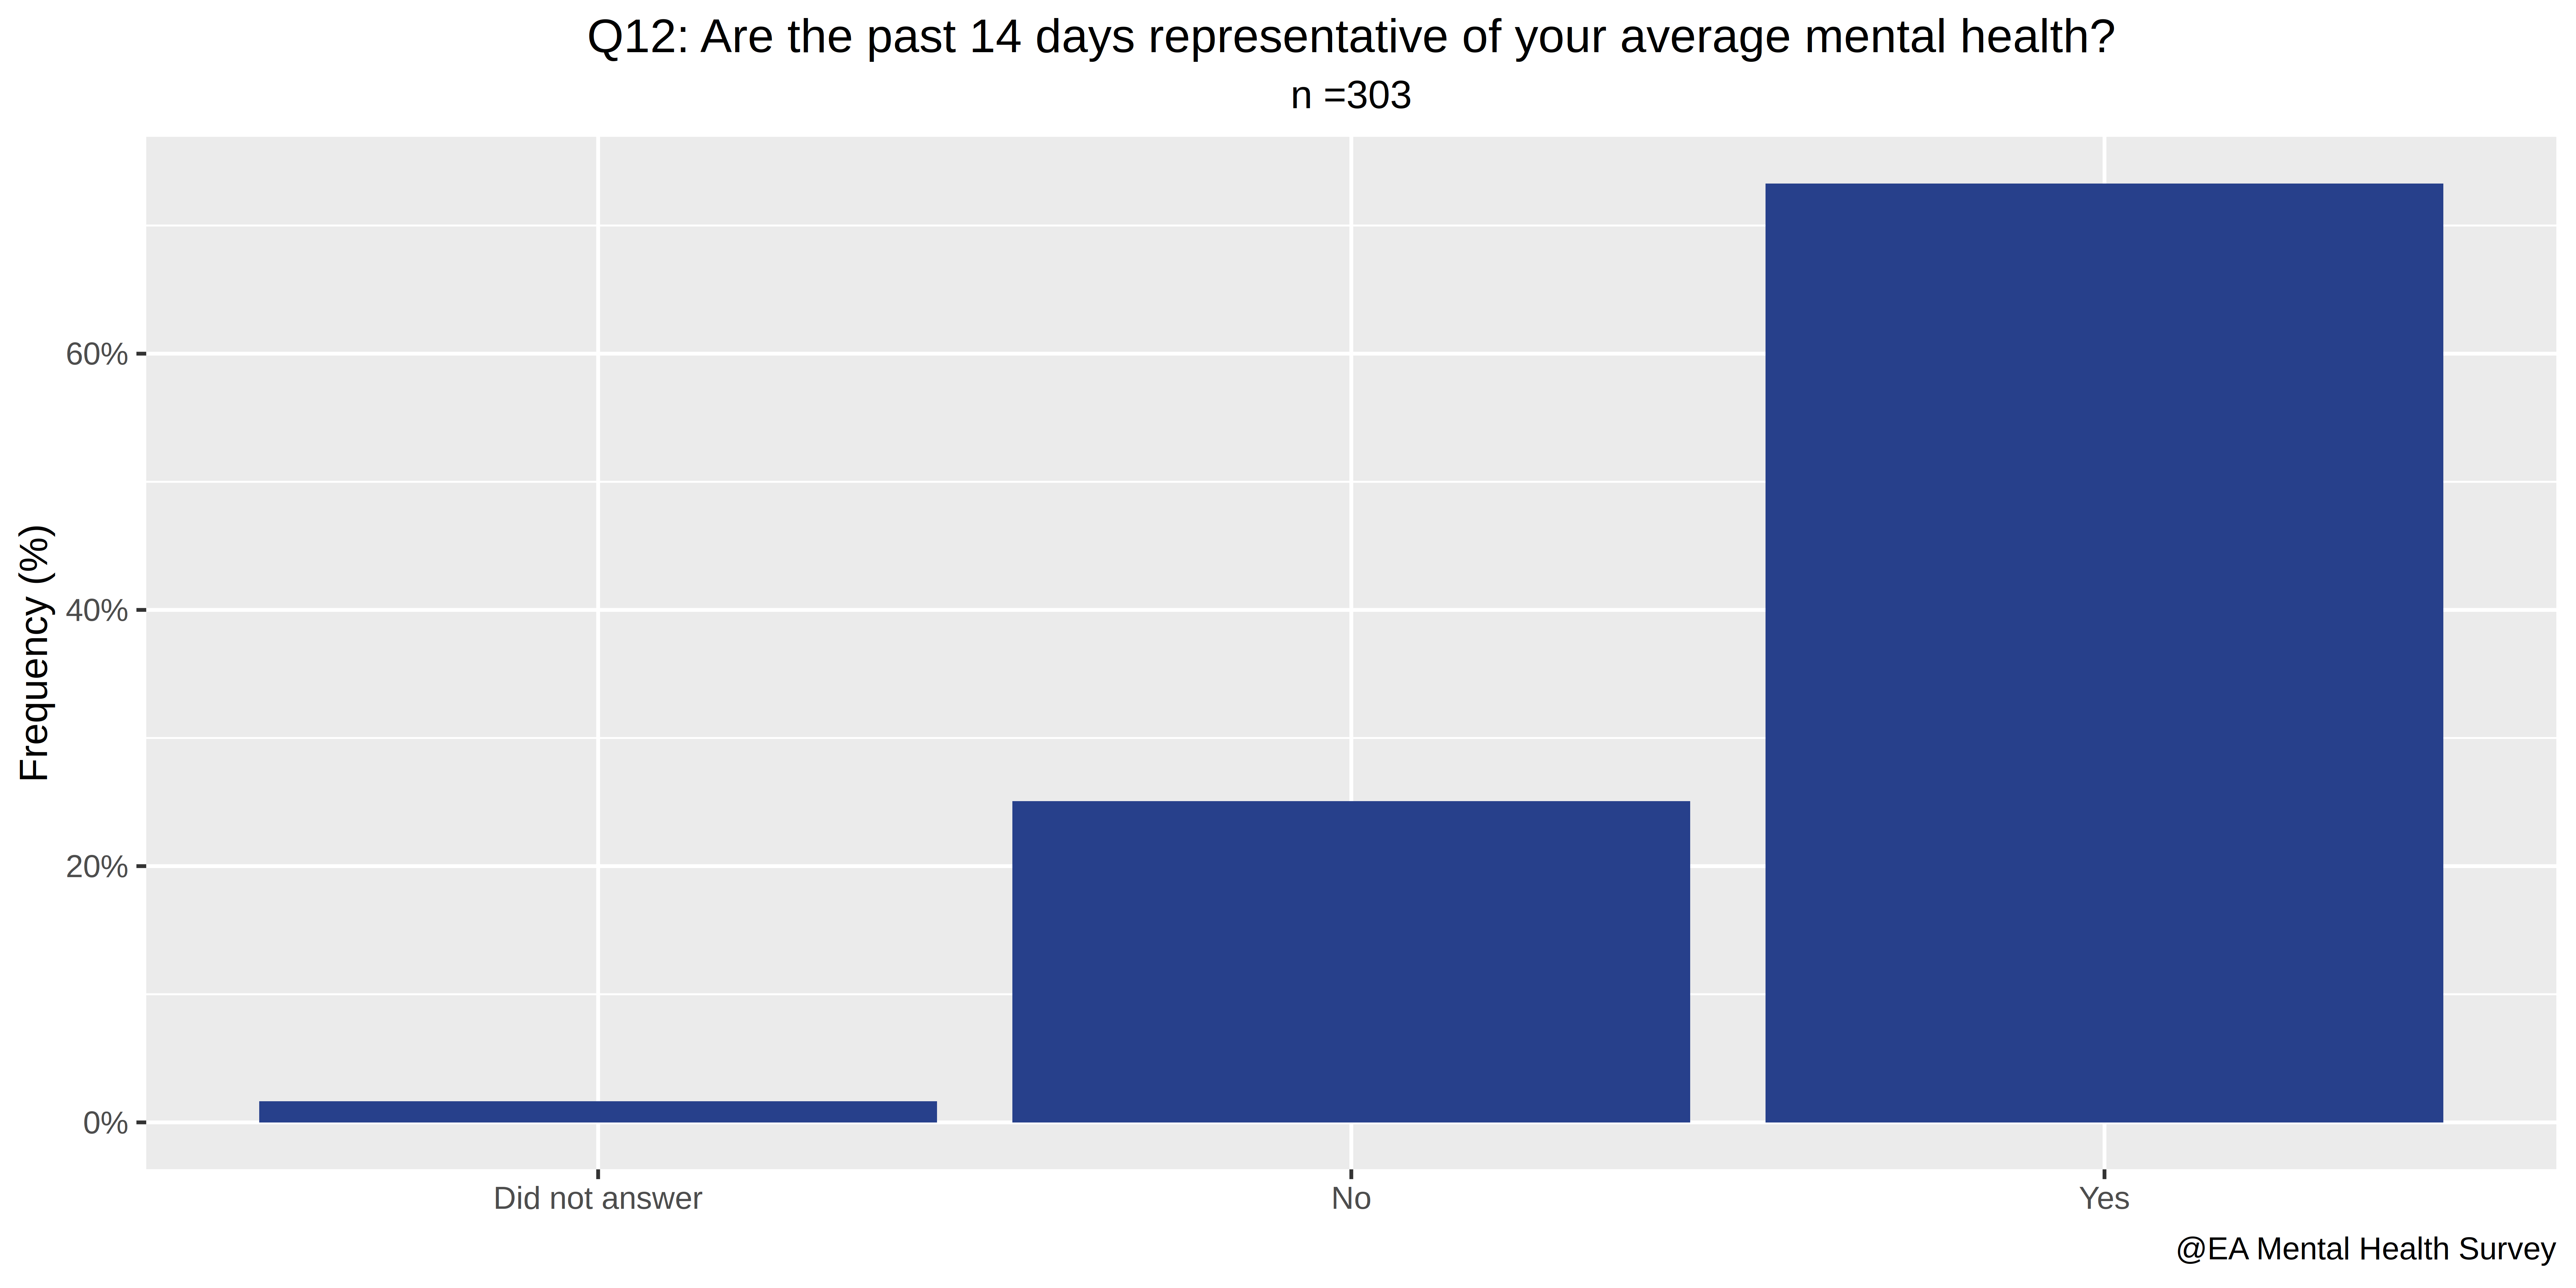
## Q12: Are the past 14 days representative of your average mental health?
ini = 2
i=ini+12
colnames(A)[i] %>%
gsub("\\."," ",.) %>%
c("Q",i-ini,": ",.,"?") %>%
paste(., collapse="") %>%
gsub(" \\?","?",.) %>%
gsub(" \\?","?",.)-> titulo
titulo
unique(A[,i])
ifelse(grepl("No", A[,i]),"No", A[,i]) -> A[,i]
ifelse(grepl("Yes", A[,i]),"Yes", A[,i]) -> A[,i]
ifelse(A[,i]=="","Did not answer", A[,i]) -> A[,i]
unique(A[,i])
(ggplot(data = A, aes(x = get(colnames(A)[i]))) +
geom_bar(
aes(y = (..count..)/sum(..count..)),
fill="royalblue4")+
labs(
title=titulo,
subtitle="n =303",
x=NULL, y="Frequency (%)",
caption="@EA Mental Health Survey"
)+
scale_y_continuous(
labels = percent_format(accuracy = 1)
)+
theme(
legend.title = element_blank(),
plot.subtitle = element_text(hjust = 0.5),
plot.title = element_text(hjust = 0.5),
legend.position="bottom"
)
)%>%
ggsave(paste(c("Q", i-ini,".png"), collapse=""), plot =., units="in", width=10, height=5, dpi=800)
## Perhaps do some linear regression model? Predict hours out of of the abstract questions + how representative it is? / whether it has been better. Exploratory plots.
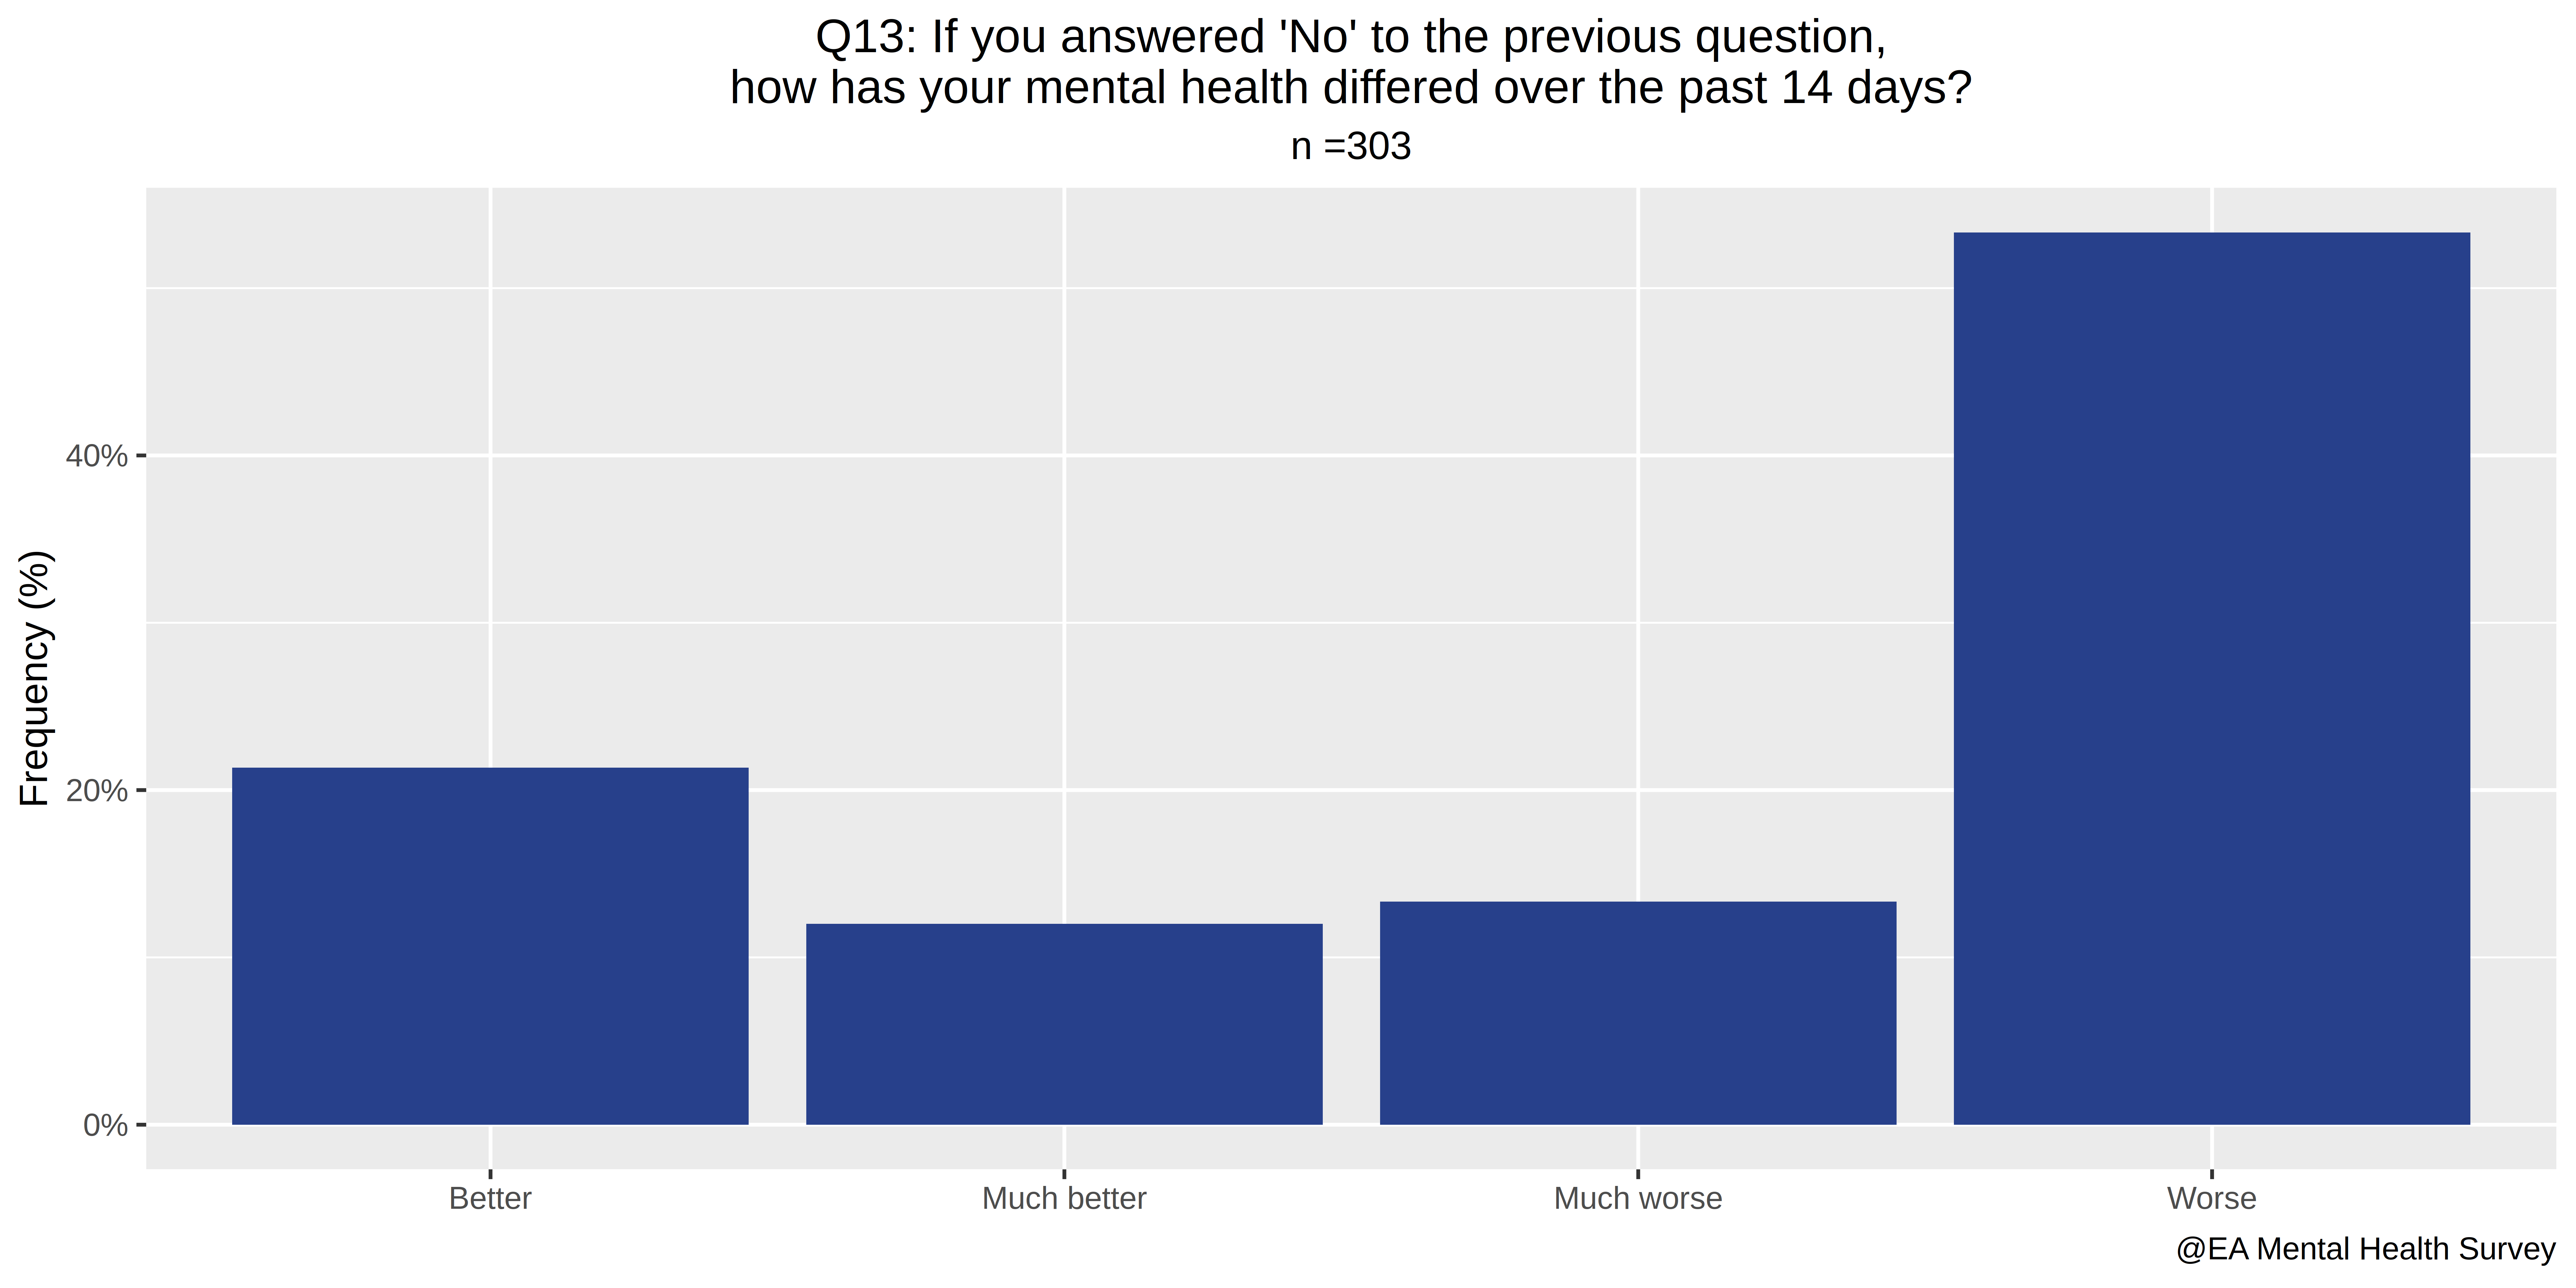
## [1] "Q13: If you answered No to the previous question how has your mental health differed over the past 14 days?"
ini = 2
i=ini+13
colnames(A)[i] %>%
gsub("\\."," ",.) %>%
c("Q",i-ini,": ",.,"?") %>%
paste(., collapse="") %>%
gsub(" \\?","?",.) %>%
gsub(" \\?","?",.)-> titulo
titulo = "Q13: If you answered 'No' to the previous question,\nhow has your mental health differed over the past 14 days?"
## The unprocessed data is just a comment. Must be processed.
## Levels: Much worse, worse, better, Much better
#representative = c()
#for(j in c(1:length(A[,i]))){
# if(A[,i][j]!=""){
# representative=c(representative, readline(paste(c("j=",j," Answer=", A[,i][j],". Value = "),collapse="")))
# }
# else{
# representative=c(representative, NA)
# }
#}
representative2 <- read.csv(file = "Q13_how_has_your_mental_health_differed_over_the_past_14_days.csv",col.names=TRUE)
as.data.frame(representative2[!is.na(representative2)]) -> rep
(ggplot(data = rep, aes(x = get(colnames(rep)[1]))) +
geom_bar(
aes(y = (..count..)/sum(..count..)),
fill="royalblue4"
)+
labs(
title=titulo,
subtitle="n =303",
x=NULL, y="Frequency (%)",
caption="@EA Mental Health Survey")+
scale_y_continuous(
labels = percent_format(accuracy = 1)
)+
theme(
legend.title = element_blank(),
plot.subtitle = element_text(hjust = 0.5),
plot.title = element_text(hjust = 0.5),
legend.position="bottom") )%>%
ggsave(paste(c("Q", i-ini,".png"), collapse=""), plot =., units="in", width=10, height=5, dpi=800)
## [1] "Q14: How challenging was it to receive the mental healthcare services you needed within the past 12 months?"
ini = 2
i=ini+14
colnames(A)[i] %>%
gsub("\\."," ",.) %>%
c("Q",i-ini,": ",.,"?") %>%
paste(., collapse="") %>%
gsub(" \\?","?",.) %>%
gsub(" \\?","?",.)-> titulo
titulo="Q14: How challenging was it to receive the mental healthcare services\n you needed within the past 12 months?"
ifelse(grepl("I have not", A[,i]), "I have not needed mental healthcare services\n in the past 12 months.", A[,i]) -> A[,i]
ifelse(grepl("I did not seek", A[,i]), "I did not seek out mental healthcare services \nin the past 12 months but believe \nI could have benefitted from them.", A[,i]) -> A[,i]
ifelse(A[,i]=="", "No answer", A[,i]) -> A[,i]
(ggplot(data = A, aes(x = get(colnames(A)[i]))) +
geom_bar(aes(y = (..count..)/sum(..count..)), fill="royalblue4")+
#coord_flip()+
coord_flip()+
scale_x_discrete(limits=unique(A[,i])[rev(c(8,1,5,4,3,2,6))])+
labs(
title=titulo,
subtitle="n =303",
x=NULL, y="Frequency (%)",
caption="@EA Mental Health Survey")+
scale_y_continuous(
labels = percent_format(accuracy = 1)
)+
theme(
legend.title = element_blank(),
plot.subtitle = element_text(hjust = 0.5),
plot.title = element_text(hjust = 0.5),
legend.position="bottom")
)%>%
ggsave(paste(c("Q", i-ini,".png"), collapse=""), plot =., units="in", width=10, height=5, dpi=800)
## [1] "Q15: How challenging is it to find useful information on mental healthcare services?"
ini = 2
i=ini+15
colnames(A)[i] %>%
gsub("\\."," ",.) %>%
c("Q",i-ini,": ",.,"?") %>%
paste(., collapse="") %>%
gsub(" \\?","?",.) %>%
gsub(" \\?","?",.)-> titulo
ifelse(A[,i]=="", "No answer", A[,i]) -> A[,i]
ifelse(grepl("I have not looked for", A[,i]),"I have not looked for information\n on mental healthcare services.", A[,i]) -> A[,i]
(ggplot(data = A, aes(x = get(colnames(A)[i]))) +
geom_bar(aes(y = (..count..)/sum(..count..)), fill="royalblue4")+
#coord_flip()+
coord_flip()+
scale_x_discrete(limits=unique(A[,i])[rev(c(7,4,1,5,3,2,6))])+
labs(
title=titulo,
subtitle="n =303",
x=NULL, y="Frequency (%)",
caption="@EA Mental Health Survey")+
scale_y_continuous(
labels = percent_format(accuracy = 1)
)+
theme(
legend.title = element_blank(),
plot.subtitle = element_text(hjust = 0.5),
plot.title = element_text(hjust = 0.5),
legend.position="bottom")
)%>%
ggsave(paste(c("Q", i-ini,".png"), collapse=""), plot =., units="in", width=12, height=5, dpi=800)
## [1] "Q16: Do you experience financial difficulties as a result of mental healthcare?"
ini = 2
i=ini+16
colnames(A)[i] %>%
gsub("\\."," ",.) %>%
c("Q",i-ini,": ",.,"?") %>%
paste(., collapse="") %>%
gsub(" \\?","?",.) %>%
gsub(" \\?","?",.)-> titulo
titulo = "Q16: Do you experience financial difficulties\nas a result of mental healthcare?"
ifelse(A[,i]=="", "No answer", A[,i]) -> A[,i]
(ggplot(data = A, aes(x = get(colnames(A)[i]))) +
geom_bar(aes(y = (..count..)/sum(..count..)), fill="royalblue4")+
#coord_flip()+
coord_flip()+
scale_x_discrete(limits=unique(A[,i])[rev(c(1,4,3,2,5))])+
labs(
title=titulo,
subtitle="n =303",
x=NULL, y="Frequency (%)",
caption="@EA Mental Health Survey")+
scale_y_continuous(
labels = percent_format(accuracy = 1)
)+
theme(
legend.title = element_blank(),
plot.subtitle = element_text(hjust = 0.5),
plot.title = element_text(hjust = 0.5),
legend.position="bottom")
)%>%
ggsave(paste(c("Q", i-ini,".png"), collapse=""), plot =., units="in", width=12, height=5, dpi=800)
## [1] "I am currently receiving the mental healthcare I need"
ini = 2
i=ini+17
colnames(A)[i] %>%
gsub("\\."," ",.) %>%
c("Q",i-ini,": ",.,"?") %>%
paste(., collapse="") %>%
gsub(" \\?","?",.) %>%
gsub(" \\?","?",.)-> titulo
titulo
titulo="Q17: I am currently receiving the mental healthcare I need"
ifelse(A[,i]=="", "No answer", A[,i]) -> A[,i]
(ggplot(data = A, aes(x = fct_infreq(get(colnames(A)[i])))) +
geom_bar(aes(y = (..count..)/sum(..count..)), fill="royalblue4")+
coord_flip()+
scale_x_discrete(limits=unique(A[,i])[rev(c(5,4, 2,1,3,6))])+
labs(
title=titulo,
subtitle="n =303",
x=NULL, y="Frequency (%)",
caption="@EA Mental Health Survey")+
scale_y_continuous(
labels = percent_format(accuracy = 1)
)+
theme(
legend.title = element_blank(),
plot.subtitle = element_text(hjust = 0.5),
plot.title = element_text(hjust = 0.5),
legend.position="bottom")
)%>%
ggsave(paste(c("Q", i-ini,".png"), collapse=""), plot =., units="in", width=12, height=5, dpi=800)
Receiving = list()
for( j in unique(A[,i])){
Receiving$answer = c(Receiving$answer,sum(A[,i]==j)/303)
Receiving$category = c(Receiving$category,j)
}
Receiving = as.data.frame(Receiving)
factor(Receiving$category, levels = Receiving$category) -> Receiving$category
Receiving = Receiving[rev(c(1,2,5,6,4,3)),]
factor(Receiving$category, levels = Receiving$category) -> Receiving$category
(ggplot(data = Receiving, aes(x="", y = answer, fill = category)) +
geom_bar(stat="identity")+
labs(
title=titulo,
subtitle="n =303",
x=NULL,
y=NULL,
caption="@EA Mental Health Survey"
)+
scale_fill_viridis_d(
#limits=unique(A[,i])[rev(c(6,1,2,5,4,3))]
)+
coord_polar(
"y",
start=0) +
theme(
axis.text = element_blank(),
axis.ticks = element_blank(),
panel.grid = element_blank())+
theme(
legend.title = element_blank(),
plot.subtitle = element_text(hjust = 0.5),
plot.title = element_text(hjust = 0.5)
)
) %>%
ggsave(paste(c("Q", i-ini,".png"), collapse=""), plot =., units="in", width=8, height=6, dpi=800)
## "Q18: How satisfied are you\nwith the mental healthcare you ve received?"
ini = 2
i=ini+18
colnames(A)[i] %>%
gsub("\\."," ",.) %>%
c("Q",i-ini,": ",.,"?") %>%
paste(., collapse="") %>%
gsub(" \\?","?",.) %>%
gsub(" \\?","?",.)-> titulo
titulo="Q18: How satisfied are you\nwith the mental healthcare you ve received?"
ifelse(A[,i]=="", "No answer", A[,i]) -> A[,i]
ifelse(A[,i]=="I have not received mental healthcare services.", "I have not received mental\nhealthcare services.", A[,i]) -> A[,i]
(ggplot(data = A, aes(x = get(colnames(A)[i]))) +
geom_bar(aes(y = (..count..)/sum(..count..)), fill="royalblue4")+
coord_flip()+
scale_x_discrete(
limits=unique(A[,i])[rev(c(5,1,4,3,2,6))]
)+
labs(
title=titulo,
subtitle="n =303",
x=NULL, y="Frequency (%)",
caption="@EA Mental Health Survey")+
scale_y_continuous(
labels = percent_format(accuracy = 1)
)+
theme(
legend.title = element_blank(),
plot.subtitle = element_text(hjust = 0.5),
plot.title = element_text(hjust = 0.5),
legend.position="bottom")
)%>%
ggsave(paste(c("Q", i-ini,".png"), collapse=""), plot =., units="in", width=12, height=5, dpi=800)
## [1] "Q19: Which of the following treatments have you tried?"
ini = 2
i=ini+19
colnames(A)[i] %>%
gsub("\\."," ",.) %>%
c("Q",i-ini,": ",.,"?") %>%
paste(., collapse="") %>%
gsub(" \\?","?",.) %>%
gsub(" \\?","?",.)-> titulo
titulo = "Which treatments have you tried?"
## The following is somewhat ugly, but I didn't want to take the time to write short code.
Treatments = list()
Treatments$num = c(Treatments$num, sum(grepl("CBT", A[,i])))
Treatments$name = c(Treatments$name, "CBT")
Treatments$num = c(Treatments$num, sum(grepl("Group therapy", A[,i])))
Treatments$name = c(Treatments$name, "Group therapy")
Treatments$num = c(Treatments$num, sum(grepl("upport", A[,i])) + sum(grepl("connection",A[,i])))
Treatments$name = c(Treatments$name, "Group / friend support")
Treatments$num = c(Treatments$num, sum(grepl("Inpatient", A[,i])))
Treatments$name = c(Treatments$name, "Inpatient mental health treatment")
Treatments$num = c(Treatments$num, sum(grepl("None", A[,i])) + sum(A[,i]==""))
Treatments$name = c(Treatments$name, "None")
Treatments$num = c(Treatments$num, sum(grepl("Meditation", A[,i])))
Treatments$name = c(Treatments$name, "Meditation,mindfulness techniques,\nalternative therapies
")
Treatments$num = c(Treatments$num, sum(grepl("Prescribed", A[,i])))
Treatments$name = c(Treatments$name, "Prescribed medication")
Treatments$num = c(Treatments$num, sum(grepl("sychotherapy", A[,i])) + sum(grepl("ounselling", A[,i])) + sum(grepl("psychology service", A[,i])))
Treatments$name = c(Treatments$name, "Psychotherapy")
Treatments$num = c(Treatments$num, sum(grepl("Self-medication", A[,i])) + sum(grepl("GABA", A[,i])) + sum(grepl("St John", A[,i])))
Treatments$name = c(Treatments$name, "Self-medication")
Treatments$num = c(Treatments$num, sum(grepl("books", A[,i])) + sum(grepl("Bibliotherapy", A[,i])))
Treatments$name = c(Treatments$name, "Books")
Treatments$num = c(Treatments$num, sum(grepl("elf-organisation", A[,i])) + sum(grepl("stick to routine", A[,i])) + sum(grepl("self-discipline", A[,i])))
Treatments$name = c(Treatments$name, "Self-discipline")
Treatments$num = c(Treatments$num, sum(grepl("ports", A[,i])) + sum(grepl("running", A[,i])) + sum(grepl("physical activity", A[,i])) + sum(grepl("exercise", A[,i])))
Treatments$name = c(Treatments$name, "Exercise")
Treatments$num = c(Treatments$num, sum(grepl("CBD", A[,i])) + sum(grepl("CFAR", A[,i])) + sum(grepl("EMDR", A[,i])) + sum(grepl("gratitude", A[,i])) + sum(grepl("diet", A[,i])) + sum(grepl("free phone consultant", A[,i])) + sum(grepl("PRI", A[,i])) + sum(grepl("practice sleep hygene", A[,i])) + sum(grepl("Sun lamp", A[,i])) + sum(grepl("Talking Space", A[,i])) + sum(grepl("Neuro-linguistic programming", A[,i])) )
Treatments$name = c(Treatments$name, "Others")
as.data.frame(Treatments) ->Treatments
Treatments[order(Treatments$num),] -> Treatments
factor(Treatments$name, levels = Treatments$name) -> Treatments$name
View(Treatments)
(ggplot(data = Treatments, aes(x = name, y = num)) +
geom_col(fill="royalblue4")+
coord_flip()+
labs(
title=titulo,
subtitle="n =303",
x=NULL, y="Frequency (%)",
caption="@EA Mental Health Survey")+
theme(
legend.title = element_blank(),
plot.subtitle = element_text(hjust = 0.5),
plot.title = element_text(hjust = 0.5),
legend.position="bottom")
)%>%
ggsave(paste(c("Q", i-ini,"-2.png"), collapse=""), plot =., units="in", width=9, height=6, dpi=800)
## [1] "Q20: Any other thoughts you d like to share on mental healthcare access?"
i=ini +20
colnames(A)[i] %>%
gsub("\\."," ",.) %>%
c("Q",i-ini,": ",.,"?") %>%
paste(., collapse="") %>%
gsub(" \\?","?",.) %>%
gsub(" \\?","?",.)-> titulo
## [1] "Q21: I believe that offering mental health resources to its members is an effective use of the EA Community's resources"
i=ini +21
colnames(A)[i] %>%
gsub("\\."," ",.) %>%
c("Q",i-ini,": ",.,"?") %>%
paste(., collapse="") %>%
gsub(" \\?","?",.) %>%
gsub(" \\?","?",.)-> titulo
titulo = "Q21: I believe that offering mental health resources to its members is an effective use of the EA Community's resources"
ifelse(A[,i]=="", "No answer", A[,i]) -> A[,i]
(ggplot(data = A, aes(x = get(colnames(A)[i]))) +
geom_bar(aes(y = (..count..)/sum(..count..)), fill="royalblue4")+
coord_flip()+
scale_x_discrete(
limits=unique(A[,i])[rev(c(3,1,2,4,6,5))]
)+
labs(
title=titulo,
subtitle="n =303",
x=NULL, y="Frequency (%)",
caption="@EA Mental Health Survey")+
scale_y_continuous(
labels = percent_format(accuracy = 1)
)+
theme(
legend.title = element_blank(),
plot.subtitle = element_text(hjust = 0.5),
plot.title = element_text(hjust = 0.5),
legend.position="bottom")
)%>%
ggsave(paste(c("Q", i-ini,".png"), collapse=""), plot =., units="in", width=12, height=5, dpi=800)
## [1] "Q22: I believe that offering mental health resources to effective altruists is NOT likely to be one of the most effective interventions available"
i=ini +22
colnames(A)[i] %>%
gsub("\\."," ",.) %>%
c("Q",i-ini,": ",.,"?") %>%
paste(., collapse="") %>%
gsub(" \\?","?",.) %>%
gsub(" \\?","?",.)-> titulo
titulo = "Q22: I believe that offering mental health resources to effective altruists\nis NOT likely to be one of the most effective interventions available"
ifelse(A[,i]=="", "No answer", A[,i]) -> A[,i]
(ggplot(data = A, aes(x = get(colnames(A)[i]))) +
geom_bar(aes(y = (..count..)/sum(..count..)), fill="royalblue4")+
coord_flip()+
scale_x_discrete(limits=unique(A[,i])[rev(c(6,3,1,2,5,4))])+
labs(
title=titulo,
subtitle="n =303",
x=NULL, y="Frequency (%)",
caption="@EA Mental Health Survey")+
scale_y_continuous(
labels = percent_format(accuracy = 1)
)+
theme(
legend.title = element_blank(),
plot.subtitle = element_text(hjust = 0.5),
plot.title = element_text(hjust = 0.5),
legend.position="bottom")
)%>%
ggsave(paste(c("Q", i-ini,".png"), collapse=""), plot =., units="in", width=12, height=5, dpi=800)
## Q23: Please explain your answers to the questions above
i=ini +23
colnames(A)[i] %>%
gsub("\\."," ",.) %>%
c("Q",i-ini,": ",.,"?") %>%
paste(., collapse="") %>%
gsub(" \\?","?",.) %>%
gsub(" \\?","?",.)-> titulo
## [1] "Q24: Do you think you could personally benefit from EA community mental health resources?"
i=ini +24
colnames(A)[i] %>%
gsub("\\."," ",.) %>%
c("Q",i-ini,": ",.,"?") %>%
paste(., collapse="") %>%
gsub(" \\?","?",.) %>%
gsub(" \\?","?",.)-> titulo
ifelse(A[,i]=="", "No answer", A[,i]) -> A[,i]
ifelse(is.na(A[,i]), "No answer", A[,i]) -> A[,i]
(ggplot(data = A, aes(x = get(colnames(A)[i]))) +
geom_bar(aes(y = (..count..)/sum(..count..)), fill="royalblue4")+
scale_x_discrete(limits=unique(A[,i])[rev(c(3,2,1,4))])+
labs(
title=titulo,
subtitle="n =303",
x=NULL, y="Frequency (%)",
caption="@EA Mental Health Survey")+
scale_y_continuous(
labels = percent_format(accuracy = 1)
)+
theme(
legend.title = element_blank(),
plot.subtitle = element_text(hjust = 0.5),
plot.title = element_text(hjust = 0.5),
legend.position="bottom")
)%>%
ggsave(paste(c("Q", i-ini,".png"), collapse=""), plot =., units="in", width=12, height=5, dpi=800)
## [1] "Q25: Which if any of the following resources do you think you could potentially benefit from?"
ini=2
i=ini +25
colnames(A)[i] %>%
gsub("\\."," ",.) %>%
c("Q",i-ini,": ",.,"?") %>%
paste(., collapse="") %>%
gsub(" \\?","?",.) %>%
gsub(" \\?","?",.)-> titulo
ifelse(A[,i]=="", "No answer", A[,i]) -> A[,i]
ifelse(is.na(A[,i]), "No answer", A[,i]) -> A[,i]
Answers = c("No answer",
"Non-clinical mental healthcare supporter/advisor",
"Employee assistance programs",
"Mental healthcare navigators",
"EA-knowledgeable therapists",
"Funds for treatment",
"Other")
s=0
t=as.vector(A[,i])
for(j in c(1:303)){
if(!(t[j]=="" | t[j]%in%Answers)){
cat("\n",j+1," - ",t[j], ":")
s=s+as.integer(readline())
}
} ## s=31
You_could_benefit=list()
for(j in Answers){
You_could_benefit$thing = c(You_could_benefit$thing, j)
You_could_benefit$count = c(You_could_benefit$count, sum(grepl(j, A[,i])))
}
as.data.frame(You_could_benefit) -> You_could_benefit
You_could_benefit$count[7] = 31
## 158 - Someone answered they could benefit from heroin. Heroin :
(ggplot(data = You_could_benefit, aes(x = thing, y = count/303 )) +
geom_col(fill="royalblue4")+
#coord_flip()+
labs(
title=titulo,
subtitle="n =303",
x=NULL,
y="Frequency (%)",
caption="@EA Mental Health Survey"
)+
coord_flip()+
scale_x_discrete(
#limits=unique(A[,i])[rev(c(3,2,1,4))]
)+
scale_y_continuous(
labels = percent_format(accuracy = 1)
)+
theme(
legend.title = element_blank(),
plot.subtitle = element_text(hjust = 0.5),
plot.title = element_text(hjust = 0.5),
legend.position="bottom")
)%>%
ggsave(paste(c("Q", i-ini,".png"), collapse=""), plot =., units="in", width=12, height=5, dpi=800)
## [1] "Q26: Any other thoughts you d like to share on EA sponsored mental health resources?"
ini=2
i=ini +26
colnames(A)[i] %>%
gsub("\\."," ",.) %>%
c("Q",i-ini,": ",.,"?") %>%
paste(., collapse="") %>%
gsub(" \\?","?",.) %>%
gsub(" \\?","?",.)-> titulo
## Country
ini=2
i=ini +27
colnames(A)[i] %>%
gsub("\\."," ",.) %>%
c("Q",i-ini,": ",.,"?") %>%
paste(., collapse="") %>%
gsub(" \\?","?",.) %>%
gsub(" \\?","?",.)-> titulo
## Age
ini=2
i=ini +28
colnames(A)[i] %>%
gsub("\\."," ",.) %>%
c("Q",i-ini,": ",.,"?") %>%
paste(., collapse="") %>%
gsub(" \\?","?",.) %>%
gsub(" \\?","?",.)-> titulo
(ggplot(data=A) +
geom_bar(
aes(x=Age),
fill="royalblue4"
)+
labs(
title=titulo,
subtitle="n =303",
x="Age",
y="Relative frequency",
caption="@EA Mental Health Survey"
)+
theme(
legend.title = element_blank(),
plot.subtitle = element_text(hjust = 0.5),
plot.title = element_text(hjust = 0.5),
axis.text.y = element_blank(),
legend.position="bottom")
) %>%
ggsave(paste(c("Q", i-ini,".png"), collapse=""), plot =., units="in", width=12, height=5, dpi=800)