
Discontinuous progress in technological trends.
AI Impacts has a list of promising research projects. One of them reads as follows:
Look for technologies that may have caused discontinuous progress on any metric. Find data for that metric over the relevant time, and measure the size of any discontinuity in terms of how many years of progress at usual rates happened at once. We have a list of technologies which others purport were discontinuous, to check. A particularly important one is recent Go AI as a discontinuity in Elo rating achievable, adjusted for hardware.
This is an input to our ongoing investigation into how frequently, and when, technological trends undergo discontinuous progress. This should inform our guesses about how likely AI development is to see discontinuous progress, both by providing a base rate, and telling us whether AI technologies seem especially susceptible. We take discontinuous progress in AI to be related to risk of fast takeoff.
Discontinuity from the SS Great Eastern
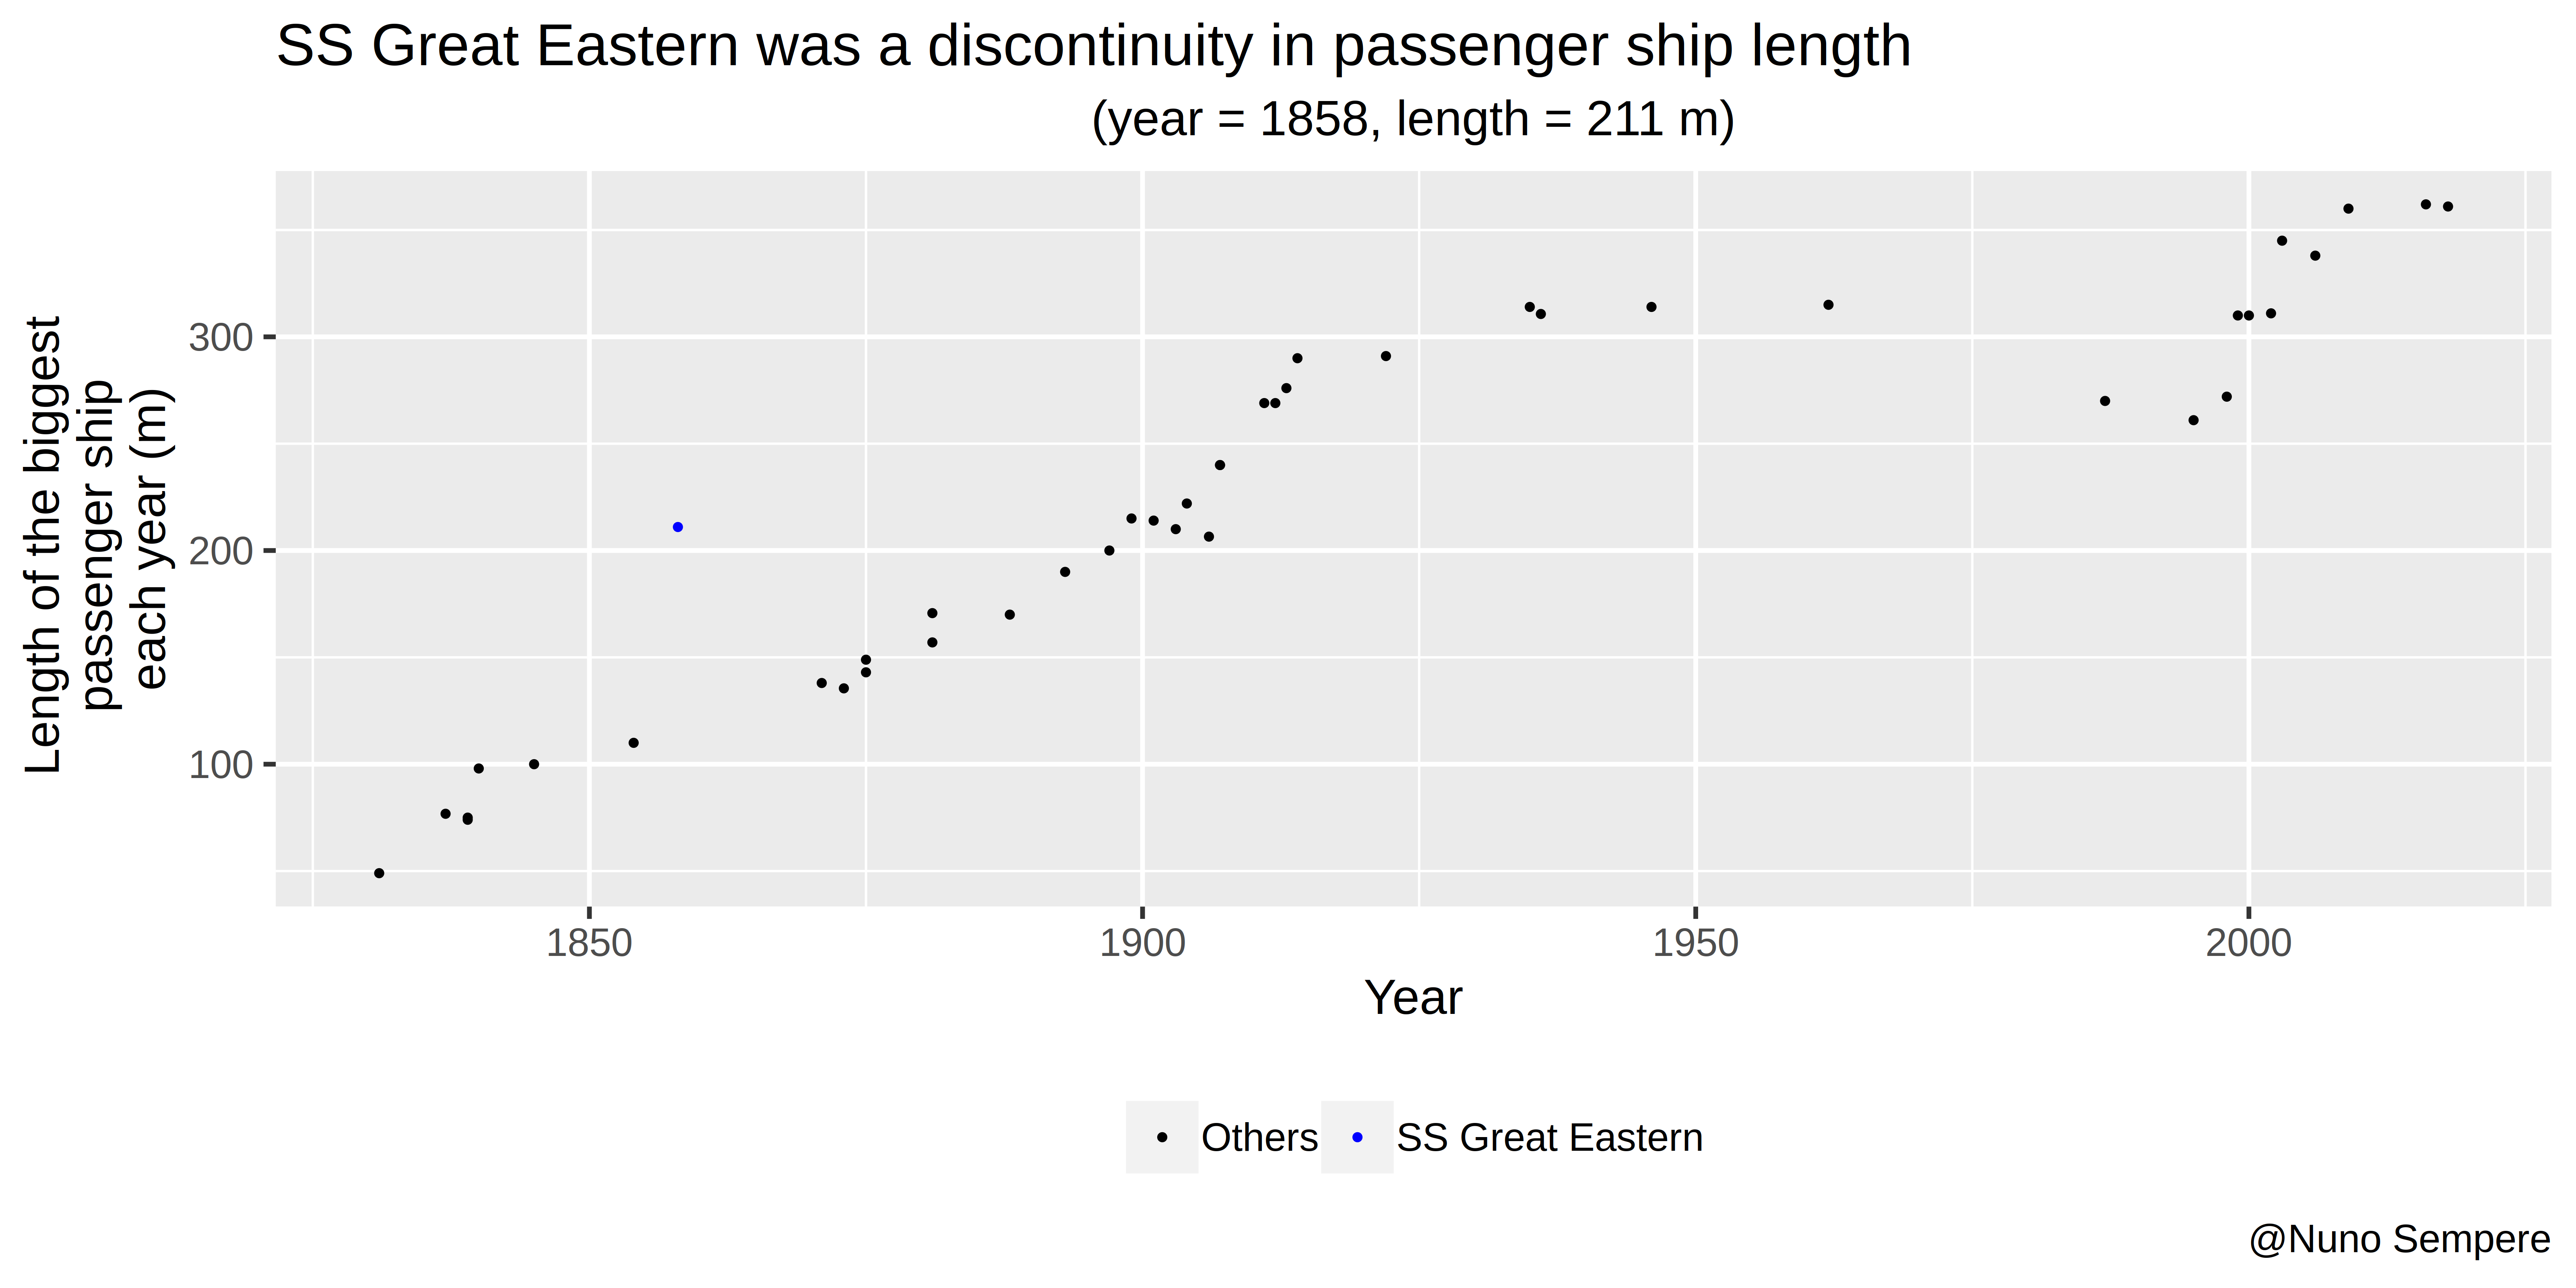
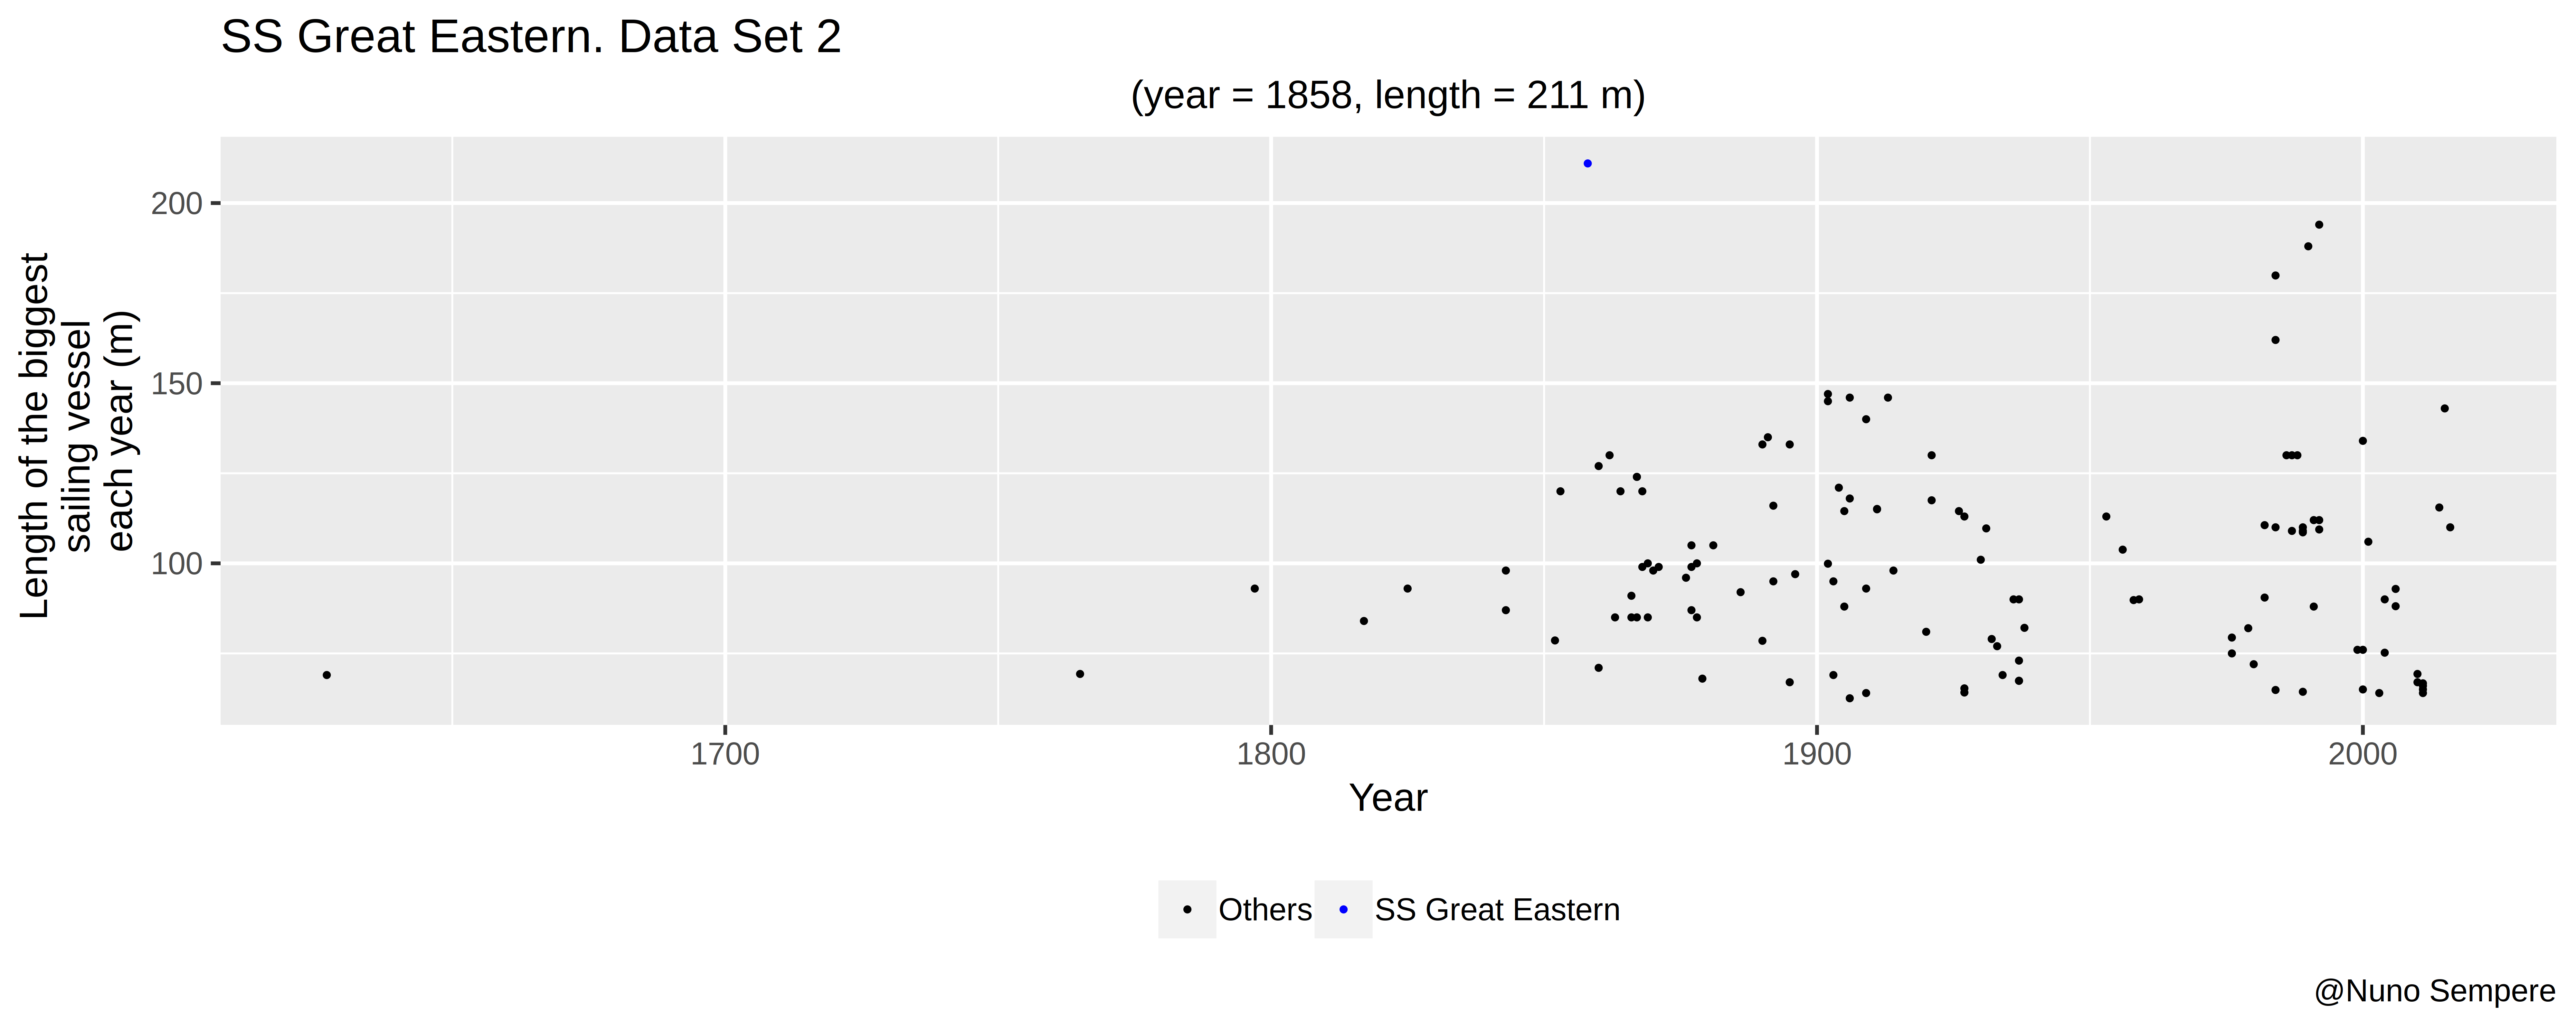
At the point of transition between wooden and metal ships, the engineer Isambard Kingdom Brunel skipped ahead and built an ambitious ship which, with a length of 211 meters, wasn’t quite twice as big as the ones preceding it: the SSC Great Eastern. It represented a discontinuity of about 40 years. Afterwards, competition between liner companies (and later, cruises) kept a discontinuity from arising, though ship size kept increasing.
Three difficulties arise: Firstly, the most convenient data only includes passenger ships. However, the categories “biggest ship” and “biggest passenger ship” were often synonymous in the period of interest: passenger ships were routinely the biggest ships at least until WW1 (SS President, the SS British Queen, SS Great Eastern, the RMS Celtic, RMS Baltic, the RMS Mauretania, the RMS Titanic, etc). However, because this can be a potential concern, we also use a second dataset on “sailing vessels”, described as:
This is a list of large sailing vessels, past and present, including sailing mega yachts, tall ships, sailing cruise ships, and large sailing military ships. It is sorted by overall length. The list, which is in the form of a table, covers vessels greater than about 200 feet (61 m) LOA, which includes overhangs and spars (length on deck or waterline length are other common measures of ship length).
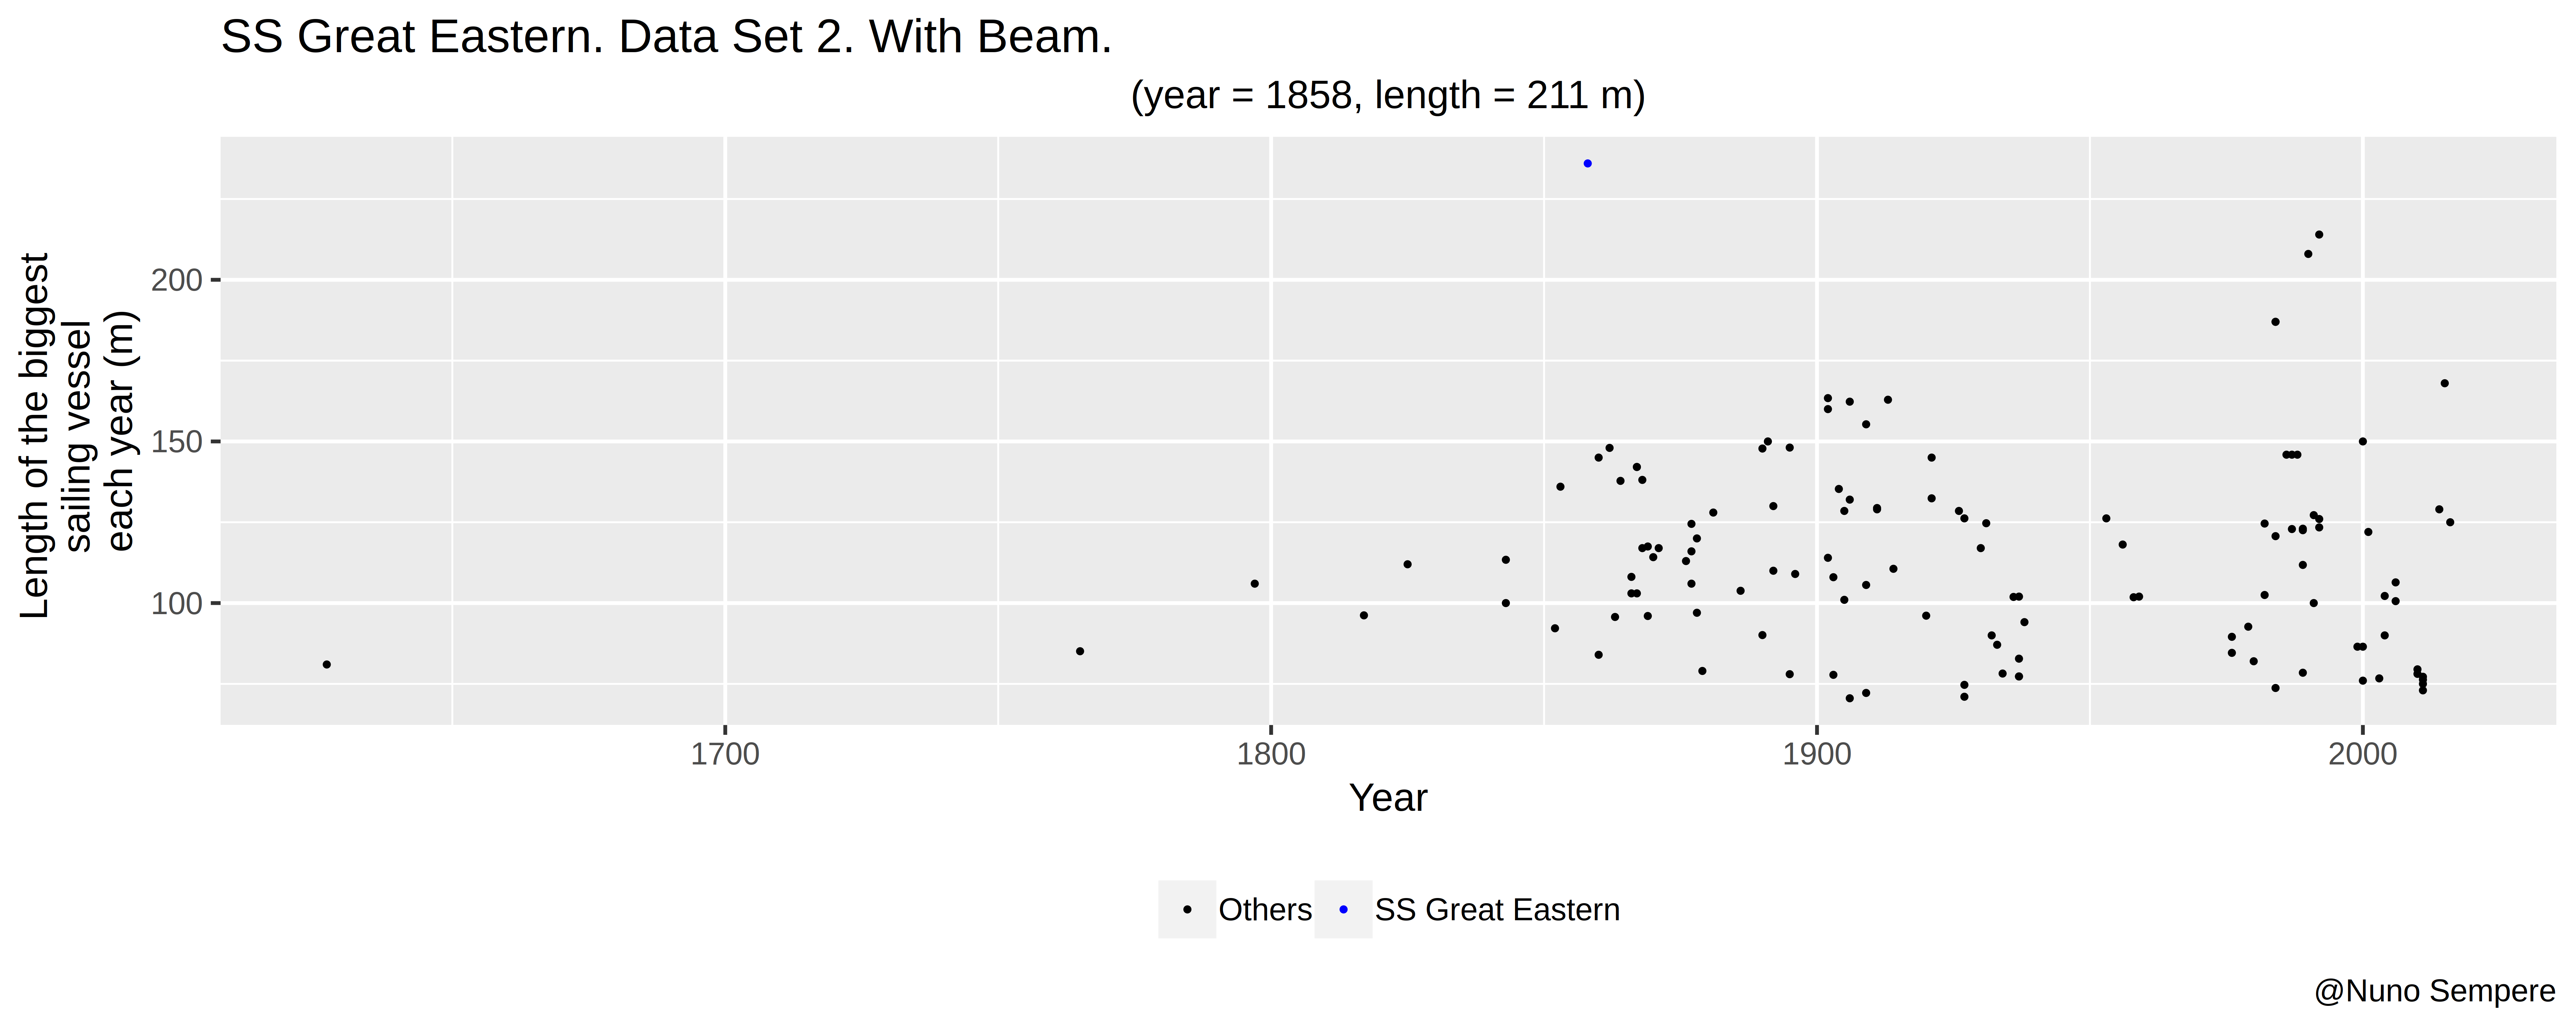
This second dataset is centered on our period of interest, and also allows to see that considering or not considering the beam doesn’t make a difference (spoiler: it doesn’t). But it is also greatly limited in that steamships, not sailing ships, started to dominate in length before the turn of the twentieth century, and thus, this dataset is most useful for comparison with ships that come before the SS Great Eastern, not afterwards.
Secondly, the sizes of the ships of antiquity are not well recorded. For this reason, the main dataset just considers data for European ships, starting in the 19th century, and exclude f.ex., Chinese, Greek and Javanese naval history. I feel that this makes sense, because the Thalamegos’s size of 115 meters (200 BCE) just wasn’t surpassed by anything in Europe until the SS Great Eastern itself, although perhaps it was by poorly documented Chinese and Javanese vessels.
Thirdly, methodological caution is in order: this example was brought to my attention precisely because of its surprisingness, and thus it’s difficult to extract conclusions about base rates. Going through this Wikipedia list of engineering branches and this other one of branches of science might prove more fruitful for arriving at base rates.
Nonetheless, perhaps the prominent role of the engineer Isambard Kingdom Brunel in the construction of the SS Great Eastern, as narrated by Wikipedia, might serve as a proof of concept that the actions of a lone individual, acting in an exploratory manner, or directly disregarding economic incentives, can lead to a decently sized technological discontinuity.
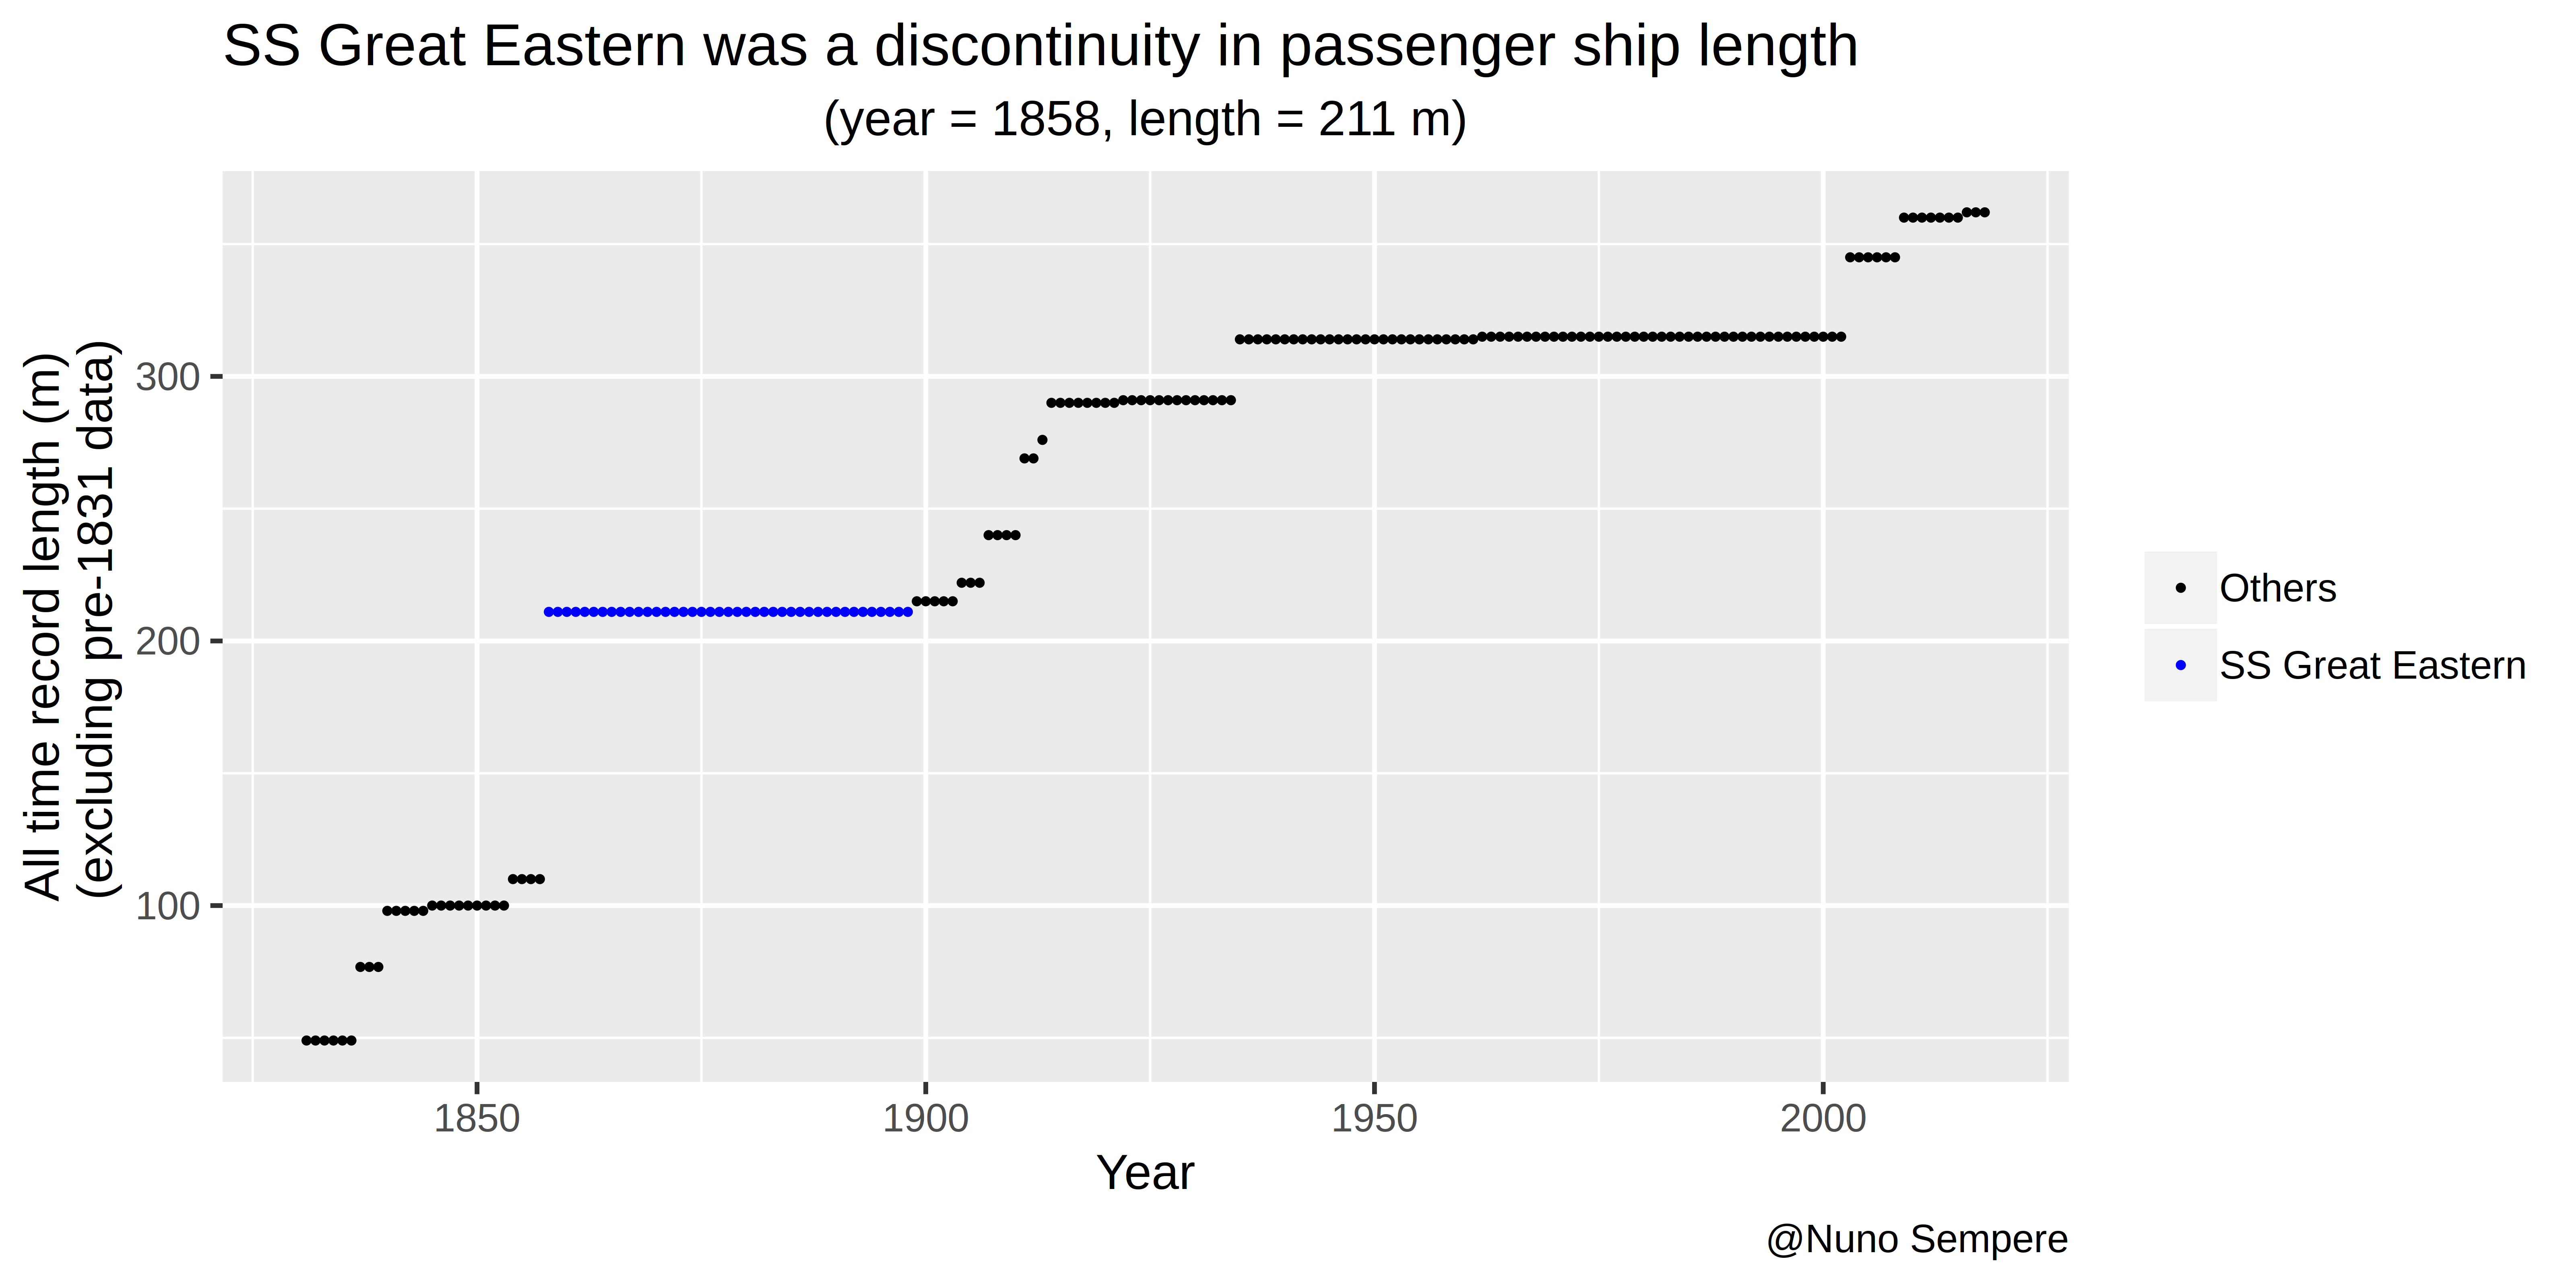
Here follow six images which make the discontinuity apparent. In the first two, we notice that the Great Eastern, built in 1858, was first surpassed in length the year 1899, for a discontinuity of 41 years. Wikipedia confirms this, and notes that the RMS Oceanic of 1899 did not exceed the Great Eastern in tonnage, only in length.
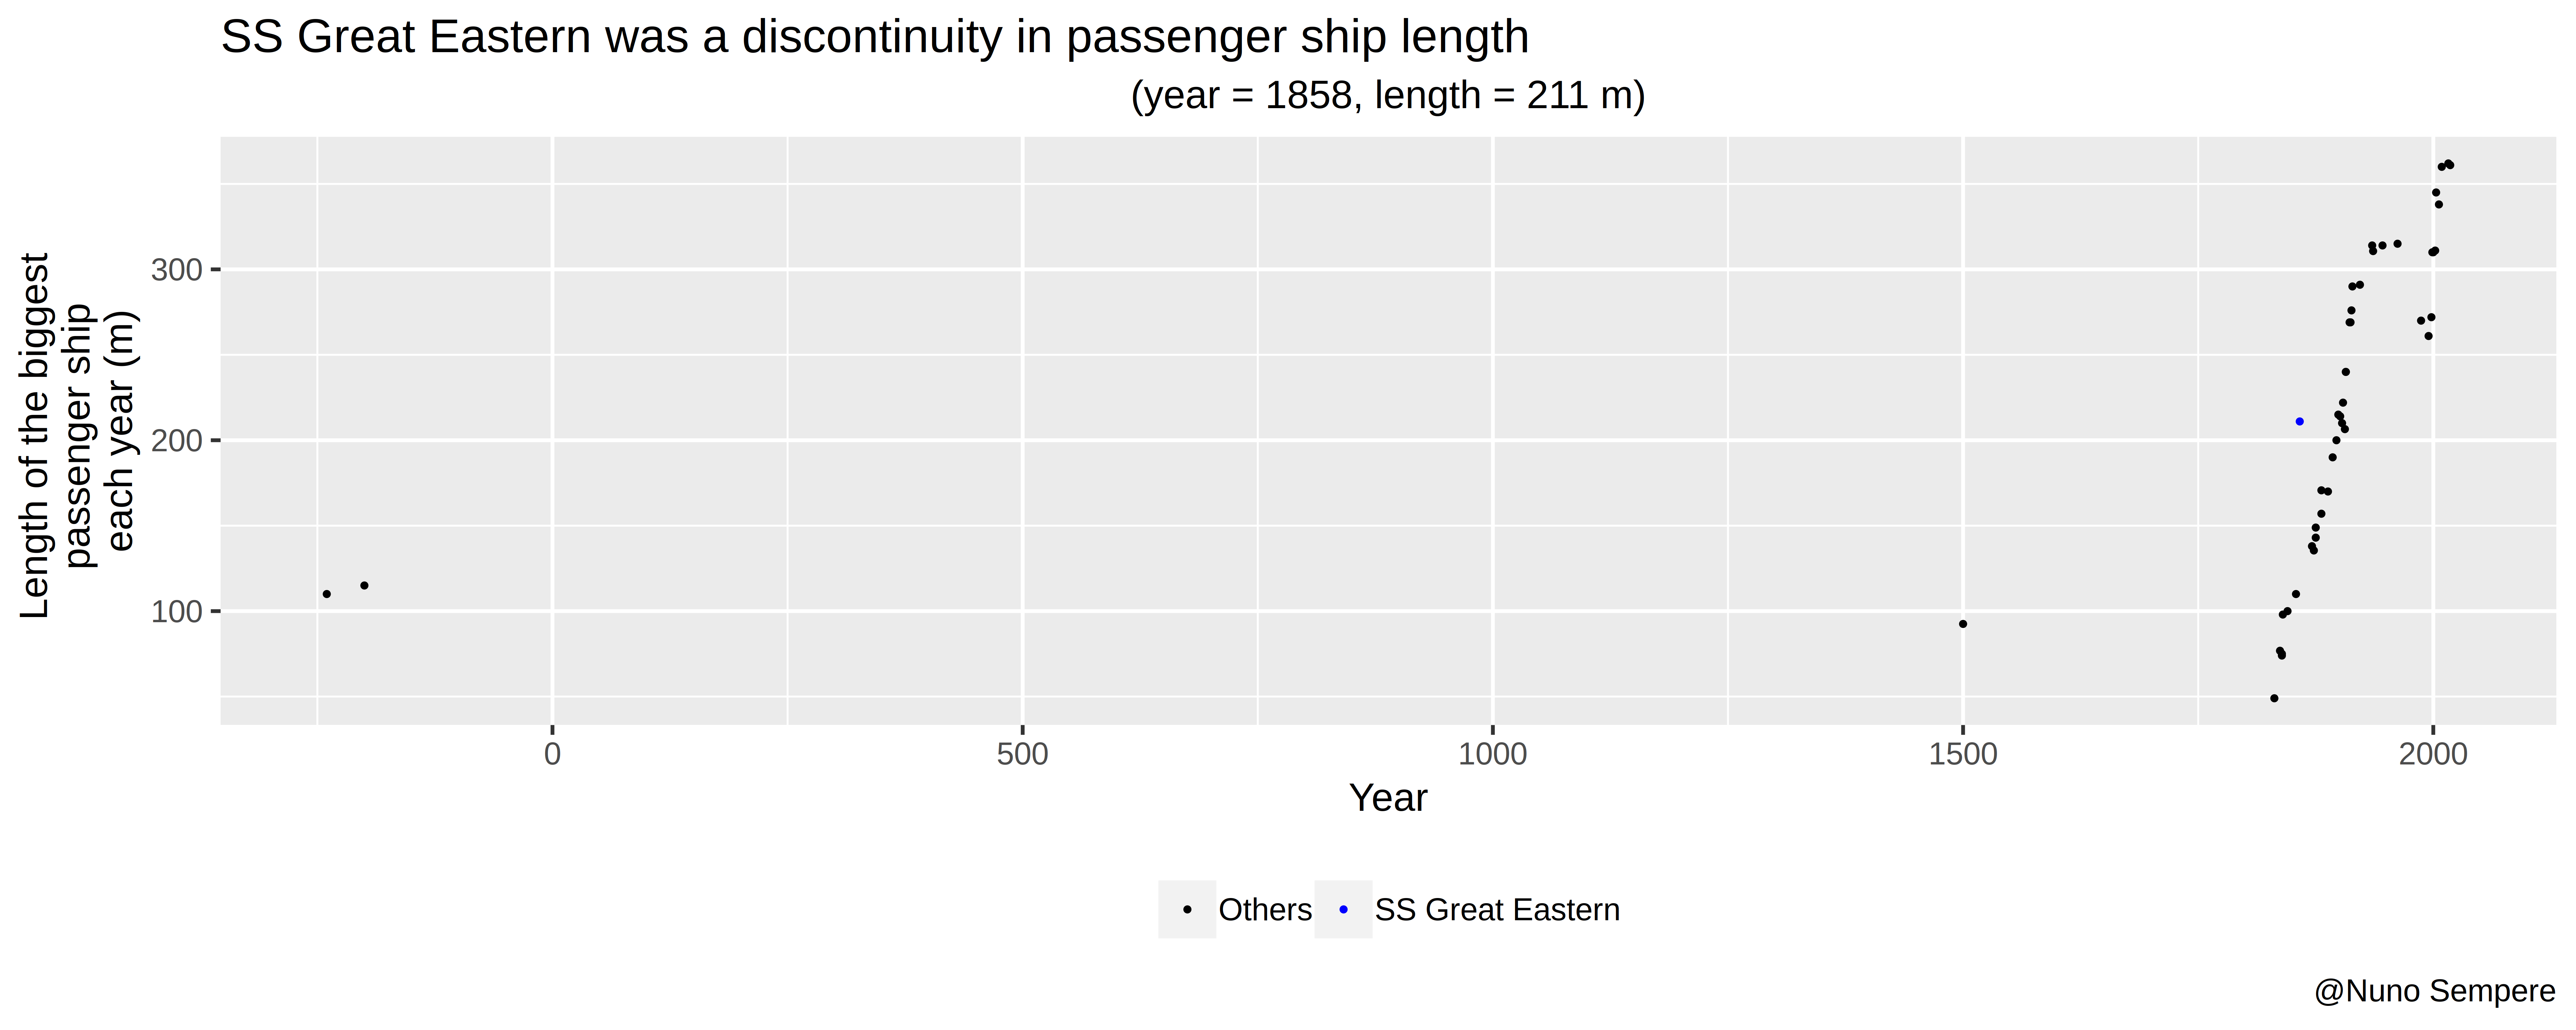
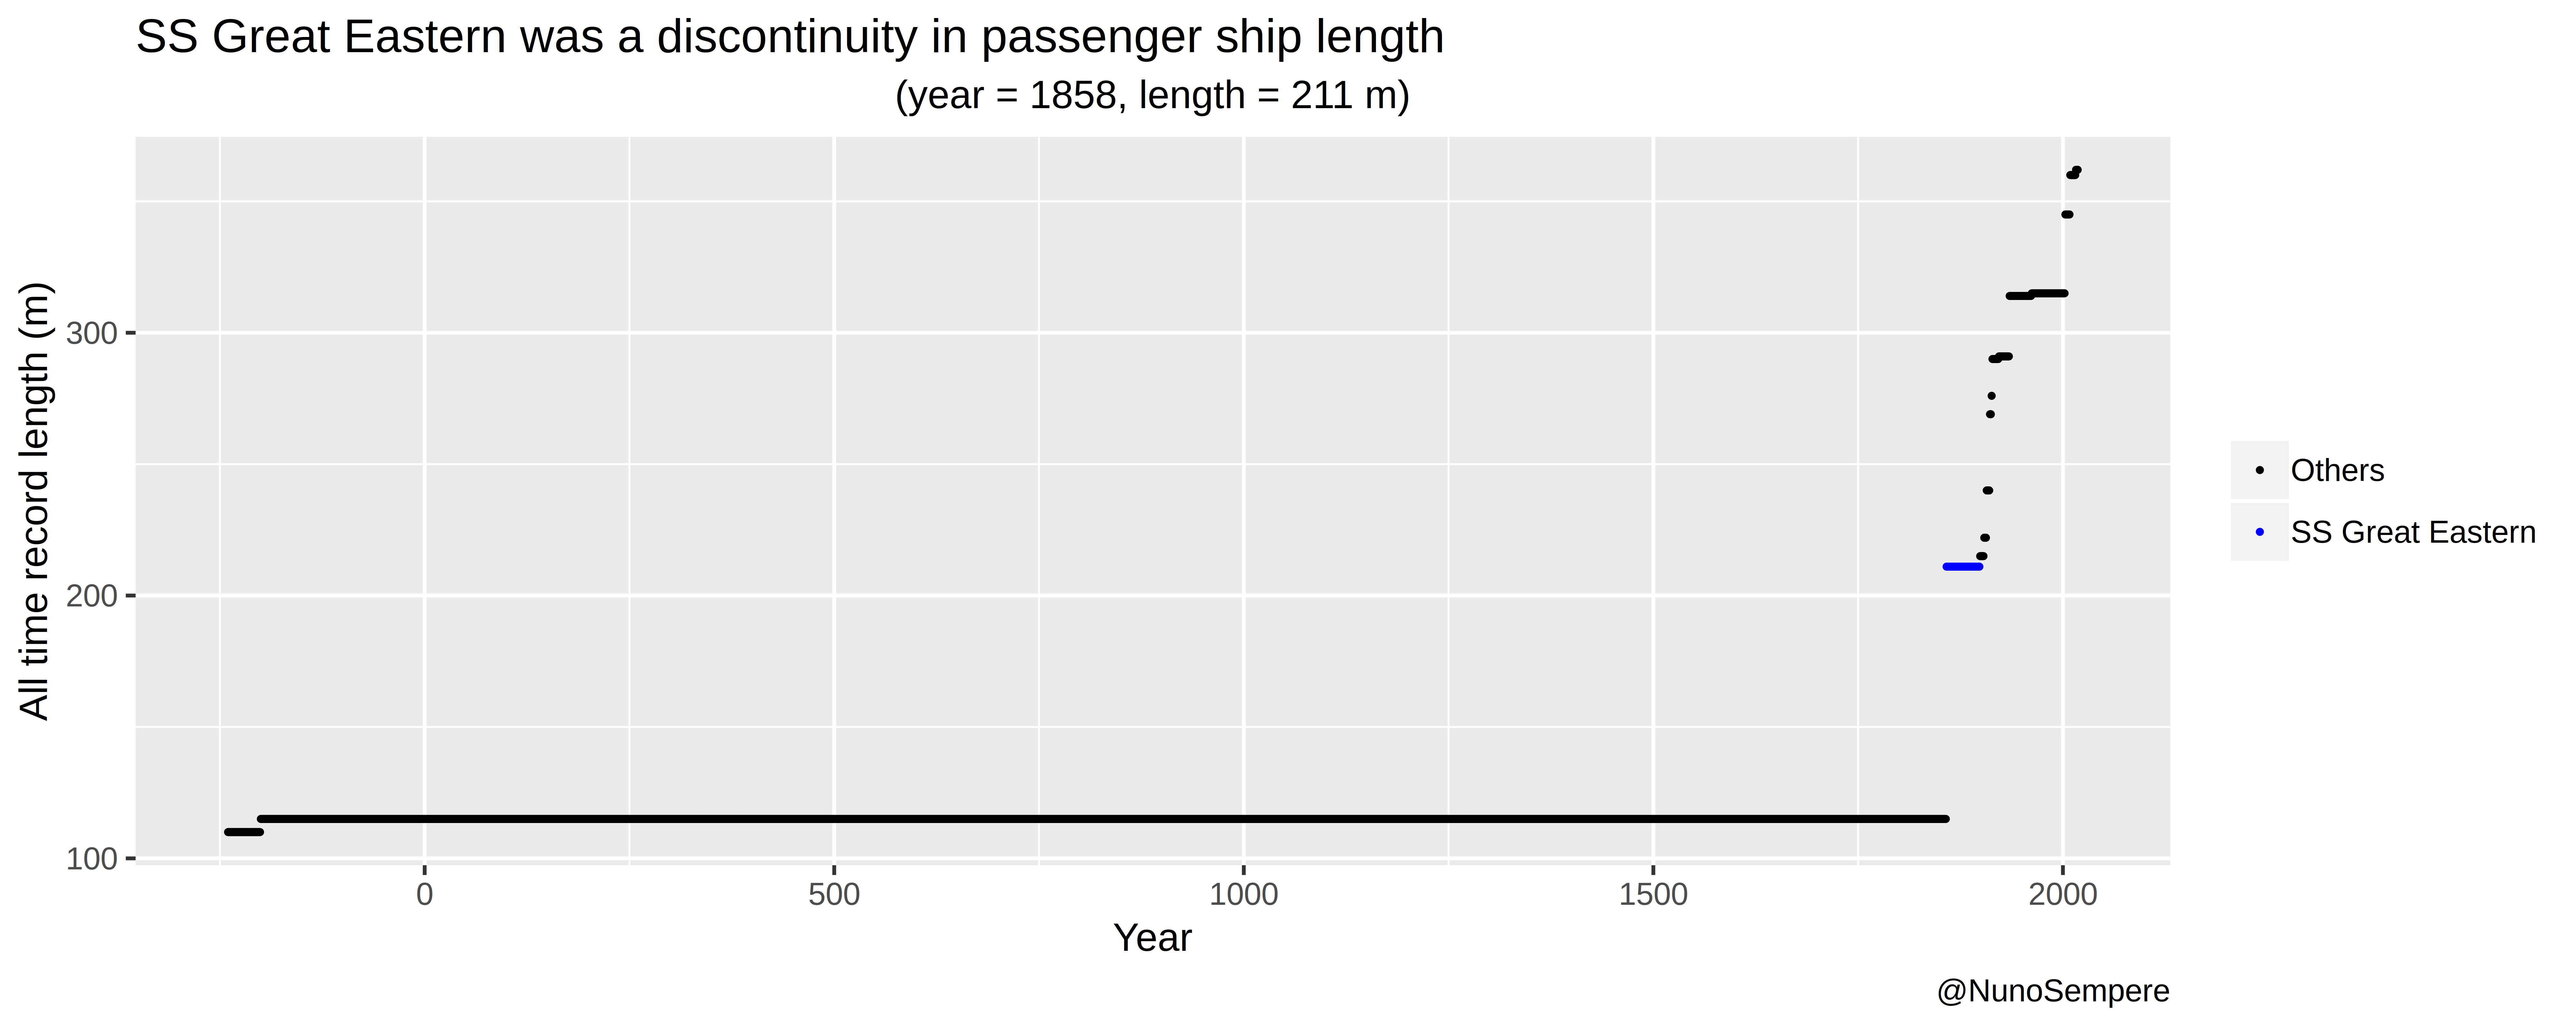
In the third and fourth images, the already mentioned Thalamegos and the Syracusia, the last of which was designed by Archimedes, are given as reference points.
The last two images correspond to our second dataset of sailing vessels. A similar picture arises.
Sources:
Wikipedia: List of longuest wooden ships
Timeline of largest passenger ships
Wikipedia: List of longuest ships
Big Ships in History, 1913, R.C. Anderson.
Wikipedia: List of large saling vessels
Data
Timeline of largest passenger ships (.csv)
Timeline of largest passenger ships, processed (.csv)
Large sailing vessels - Dataset 2 (.csv)
Large sailing vessels - Dataset 2, processed (.csv)
Discontinuity in the time needed to circumnavigate the Earth
Consider circumnavigating the Earth, that is, travelling in the same direction until one returns to the same point on the globe. As technology develops, the time needed to do that gets shorter and shorter. We find 4 discontinuities:
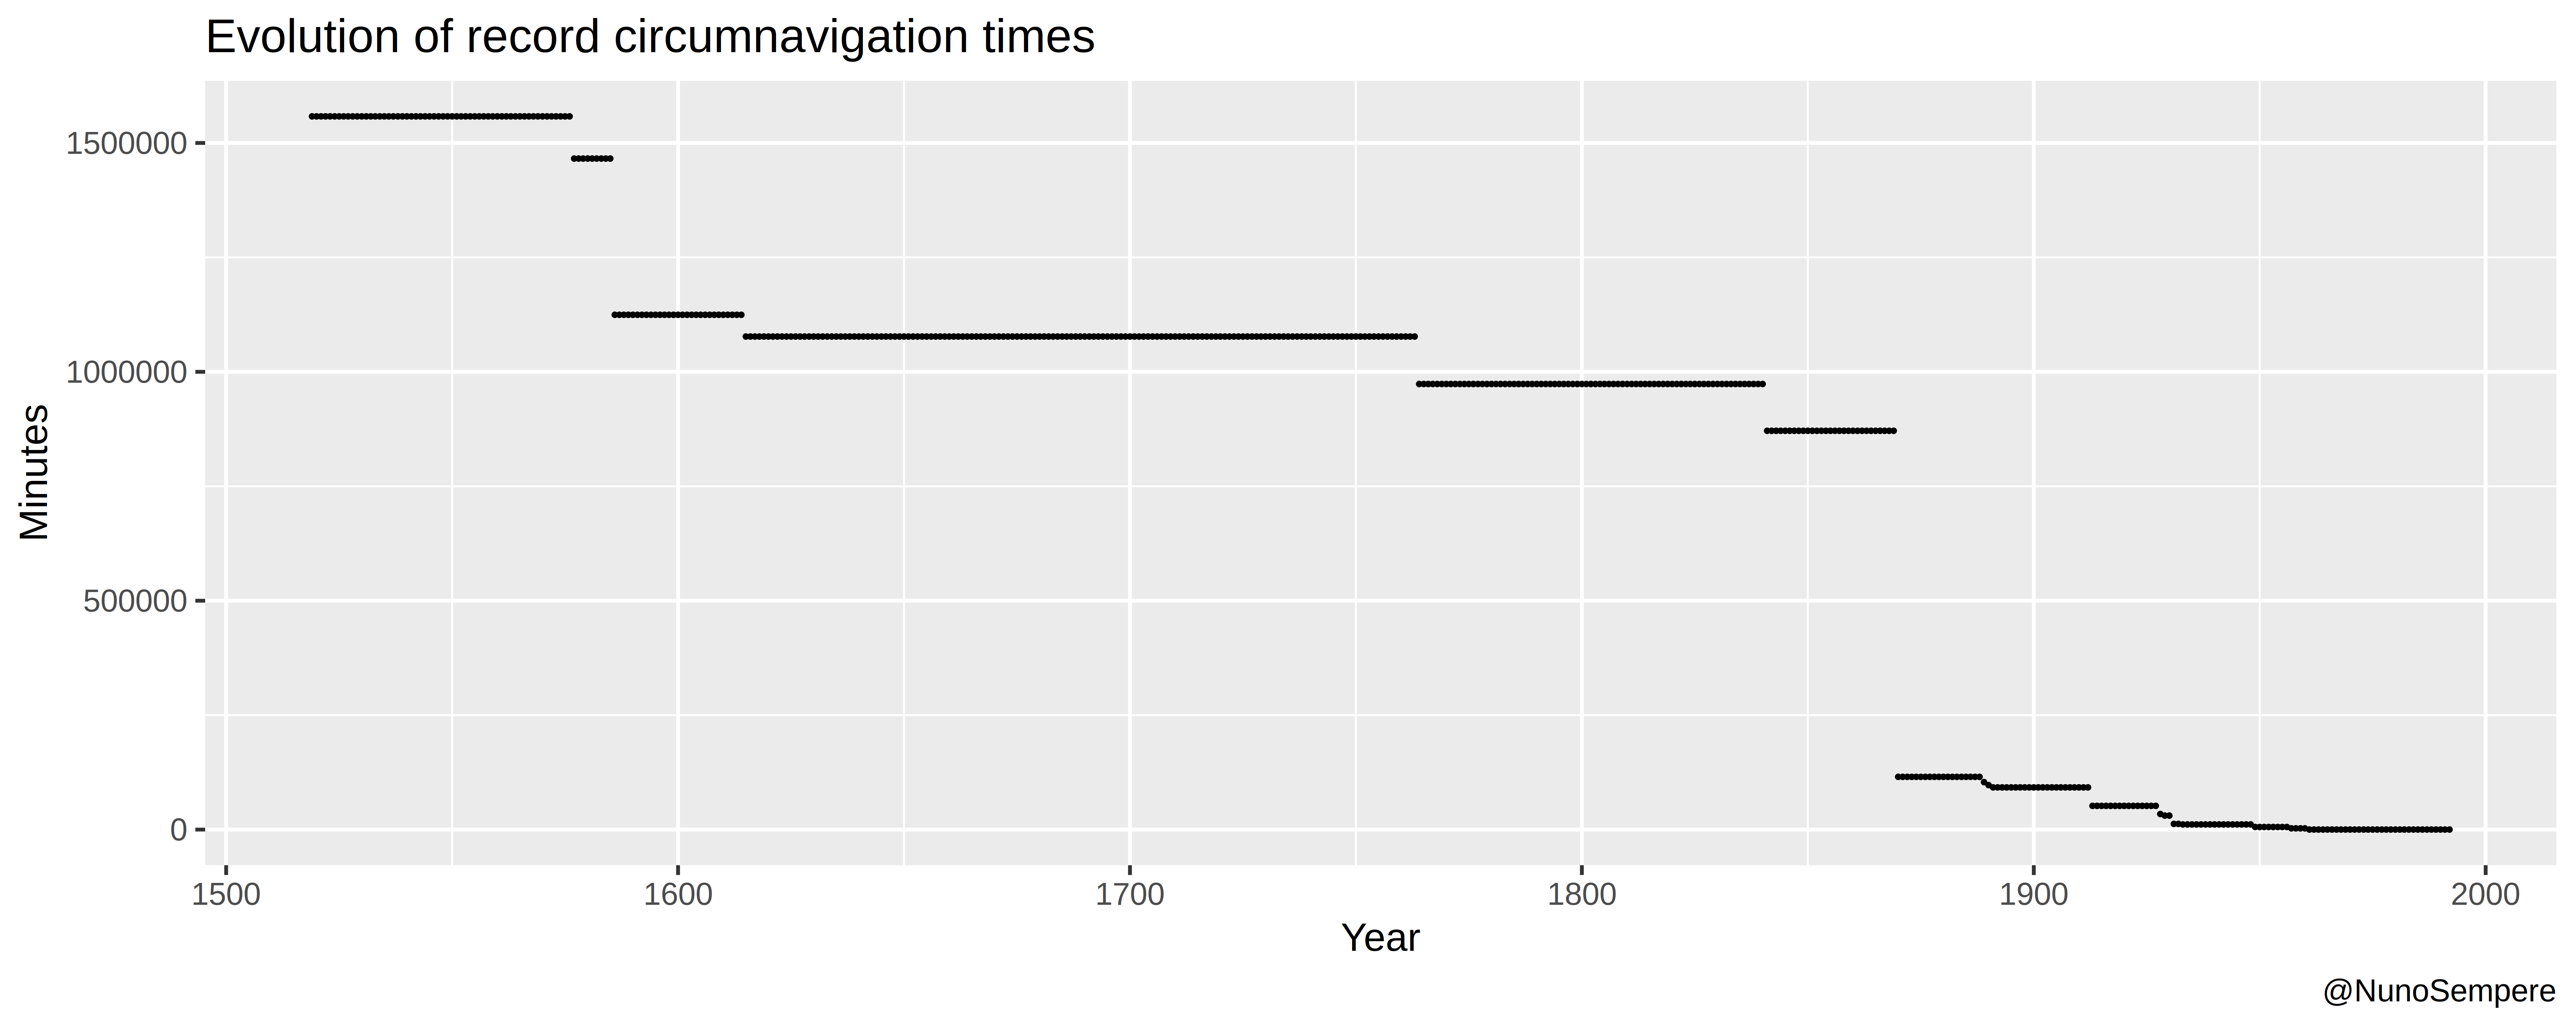
- From the first two explorers to later followers. Year = 1586. Estimated discontinuity equivalent to 203 / 240 years of previous progress.
- From big expeditions to liners and trains. Year 1870. Estimated discontinuity equivalent to 740 / 1986 years of equivalent previous progress.
- From ships to aircraft. Year 1931. Estimated discontinuity equivalent to 11 / 40.5 years
- From military aircraft to the first cosmonaut, Yuri Gagarin. Year 1961. Estimated discontinuity equivalent to 1 / 27.5 years.
The precise magnitude of these discontinuities depends on whether we measure time, or its logarithm. In both cases, we get very large discontinuities, plausibly of more than 100 years. However, our estimates are inexact. In particular, our data only shines in the period 1870 - 1961, and thus we are most confident in the discontinuity created by the first circumnavigation by plane (as opposed to by ship & train). This happened in 1931 and our two estimates of the magnitude of that discontinuity are 11 and 40.5 years.
According to the first model, the first cosmonaut wasn’t really a discontinuity (a deviation of 1 year from the predicted value. But note that this model would have predicted negative times after a while). Furthermore, if we estimate the next data point extrapolating the previous progress linearly, we get four-ish discontinuities. But as the graphs below show, the natural fit is not linear, it’s hyperbolic / exponential-ish. So here definitions also get in the way, because whether any point is a discontinuity depends on which model we use to extrapolate from past data.
Throughout the 19th century, we see ships develop into faster and faster ships, and then give way to planes, which in turn gain in speed, until they’re all overtaken by Yuri Gagarin in a rocket. This repeated upmanship is what’s downstream of the exponential shape, and you couldn’t have predicted that by extrapolating the very real gains in ship speed at the beginning of the century; you couldn’t have predicted rockets. As for the implications for AI scenarios, this example may serve to ilustrate the mechanics of how very fast progress can look like on the inside, and adds another datapoint for AI Impact’s base rate estimation.
As to the visualization of the above: If we plot the overall time record, in minutes, we can appreciate the first two discontinuities.
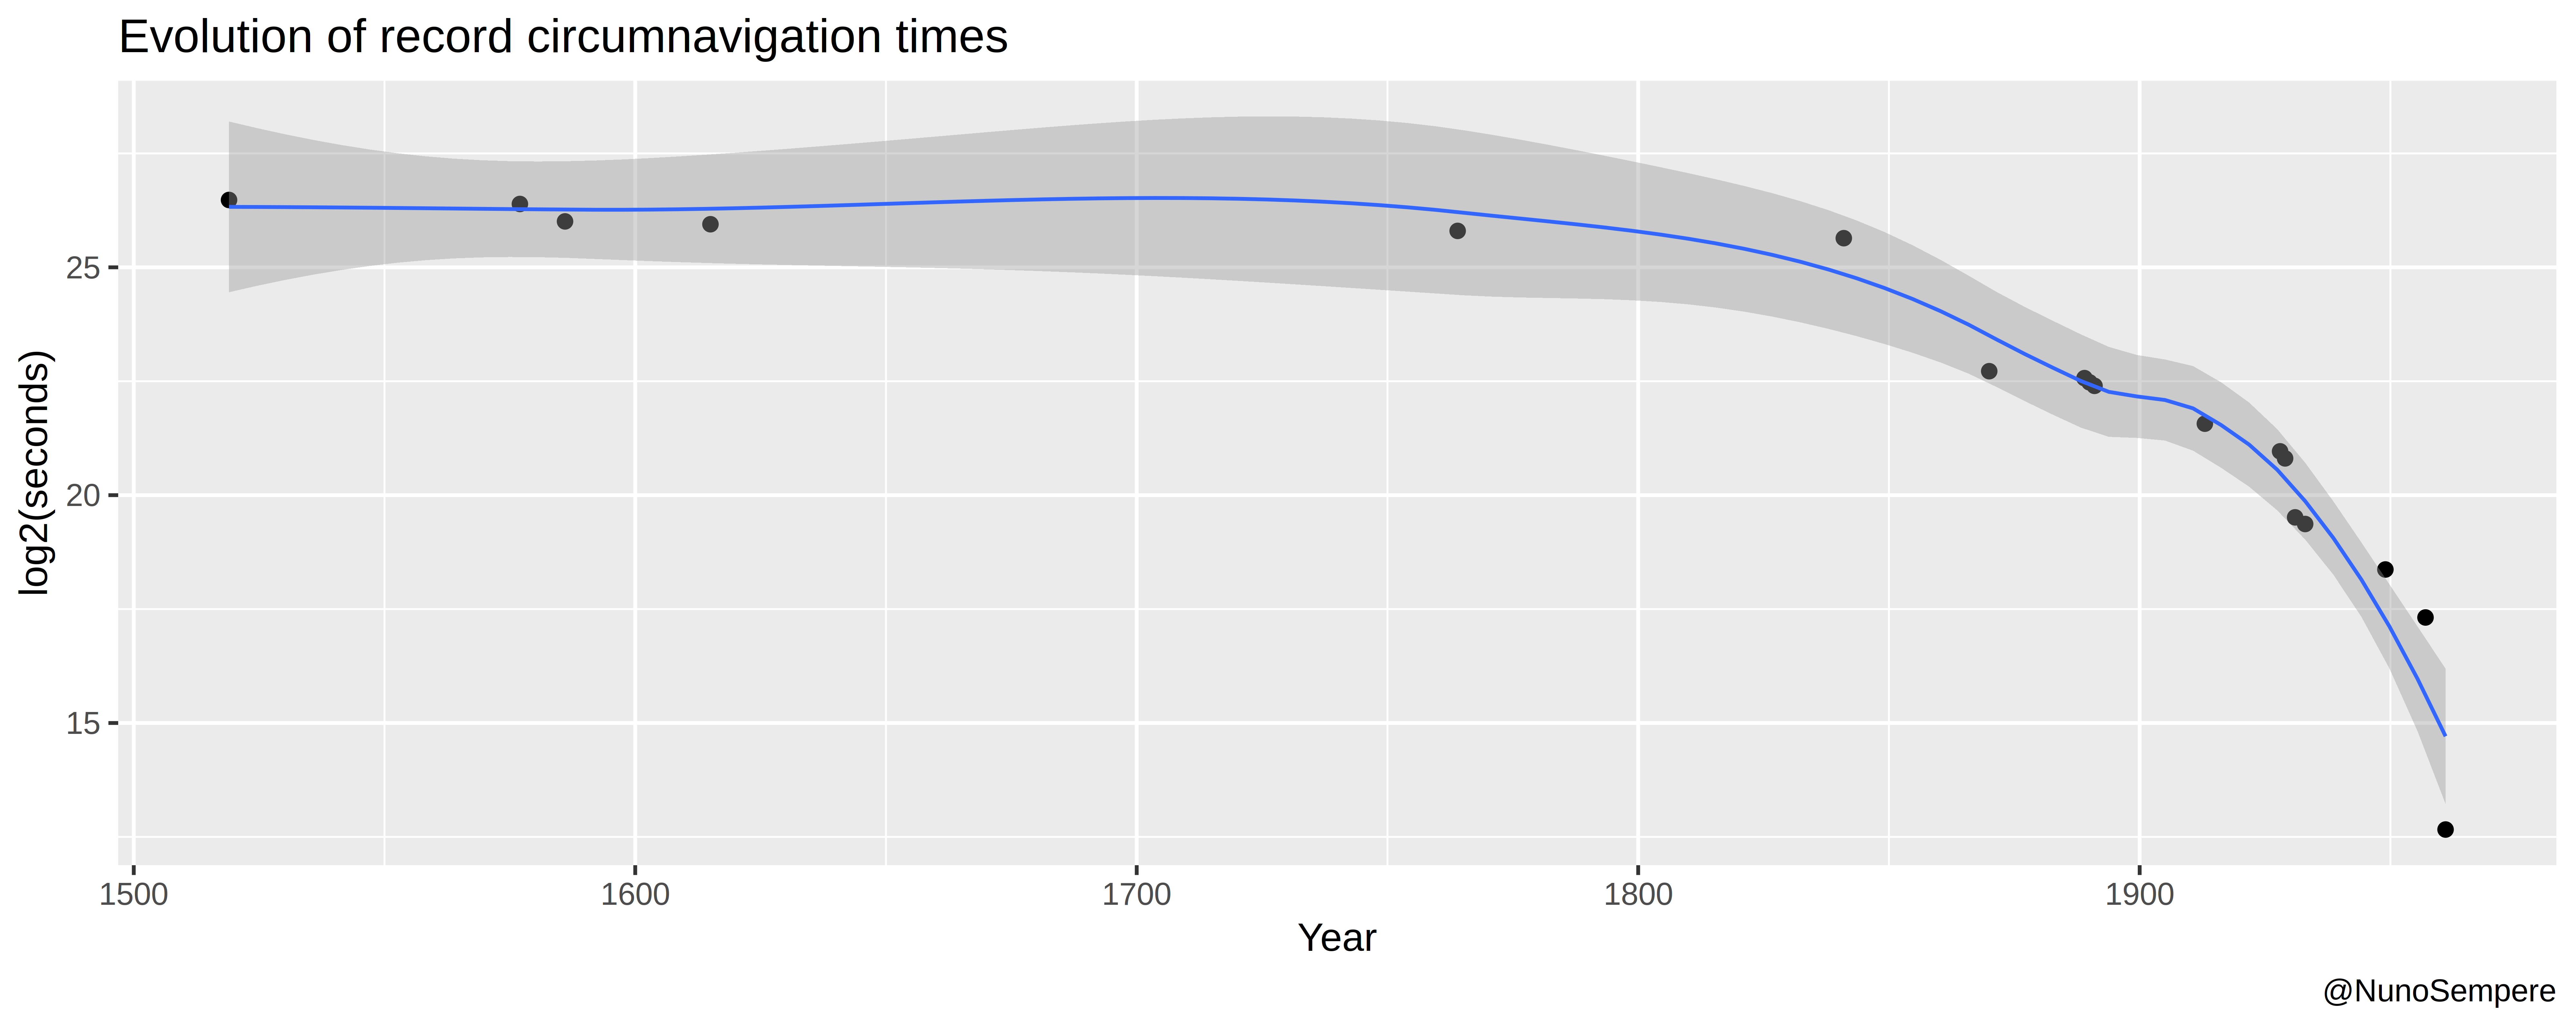
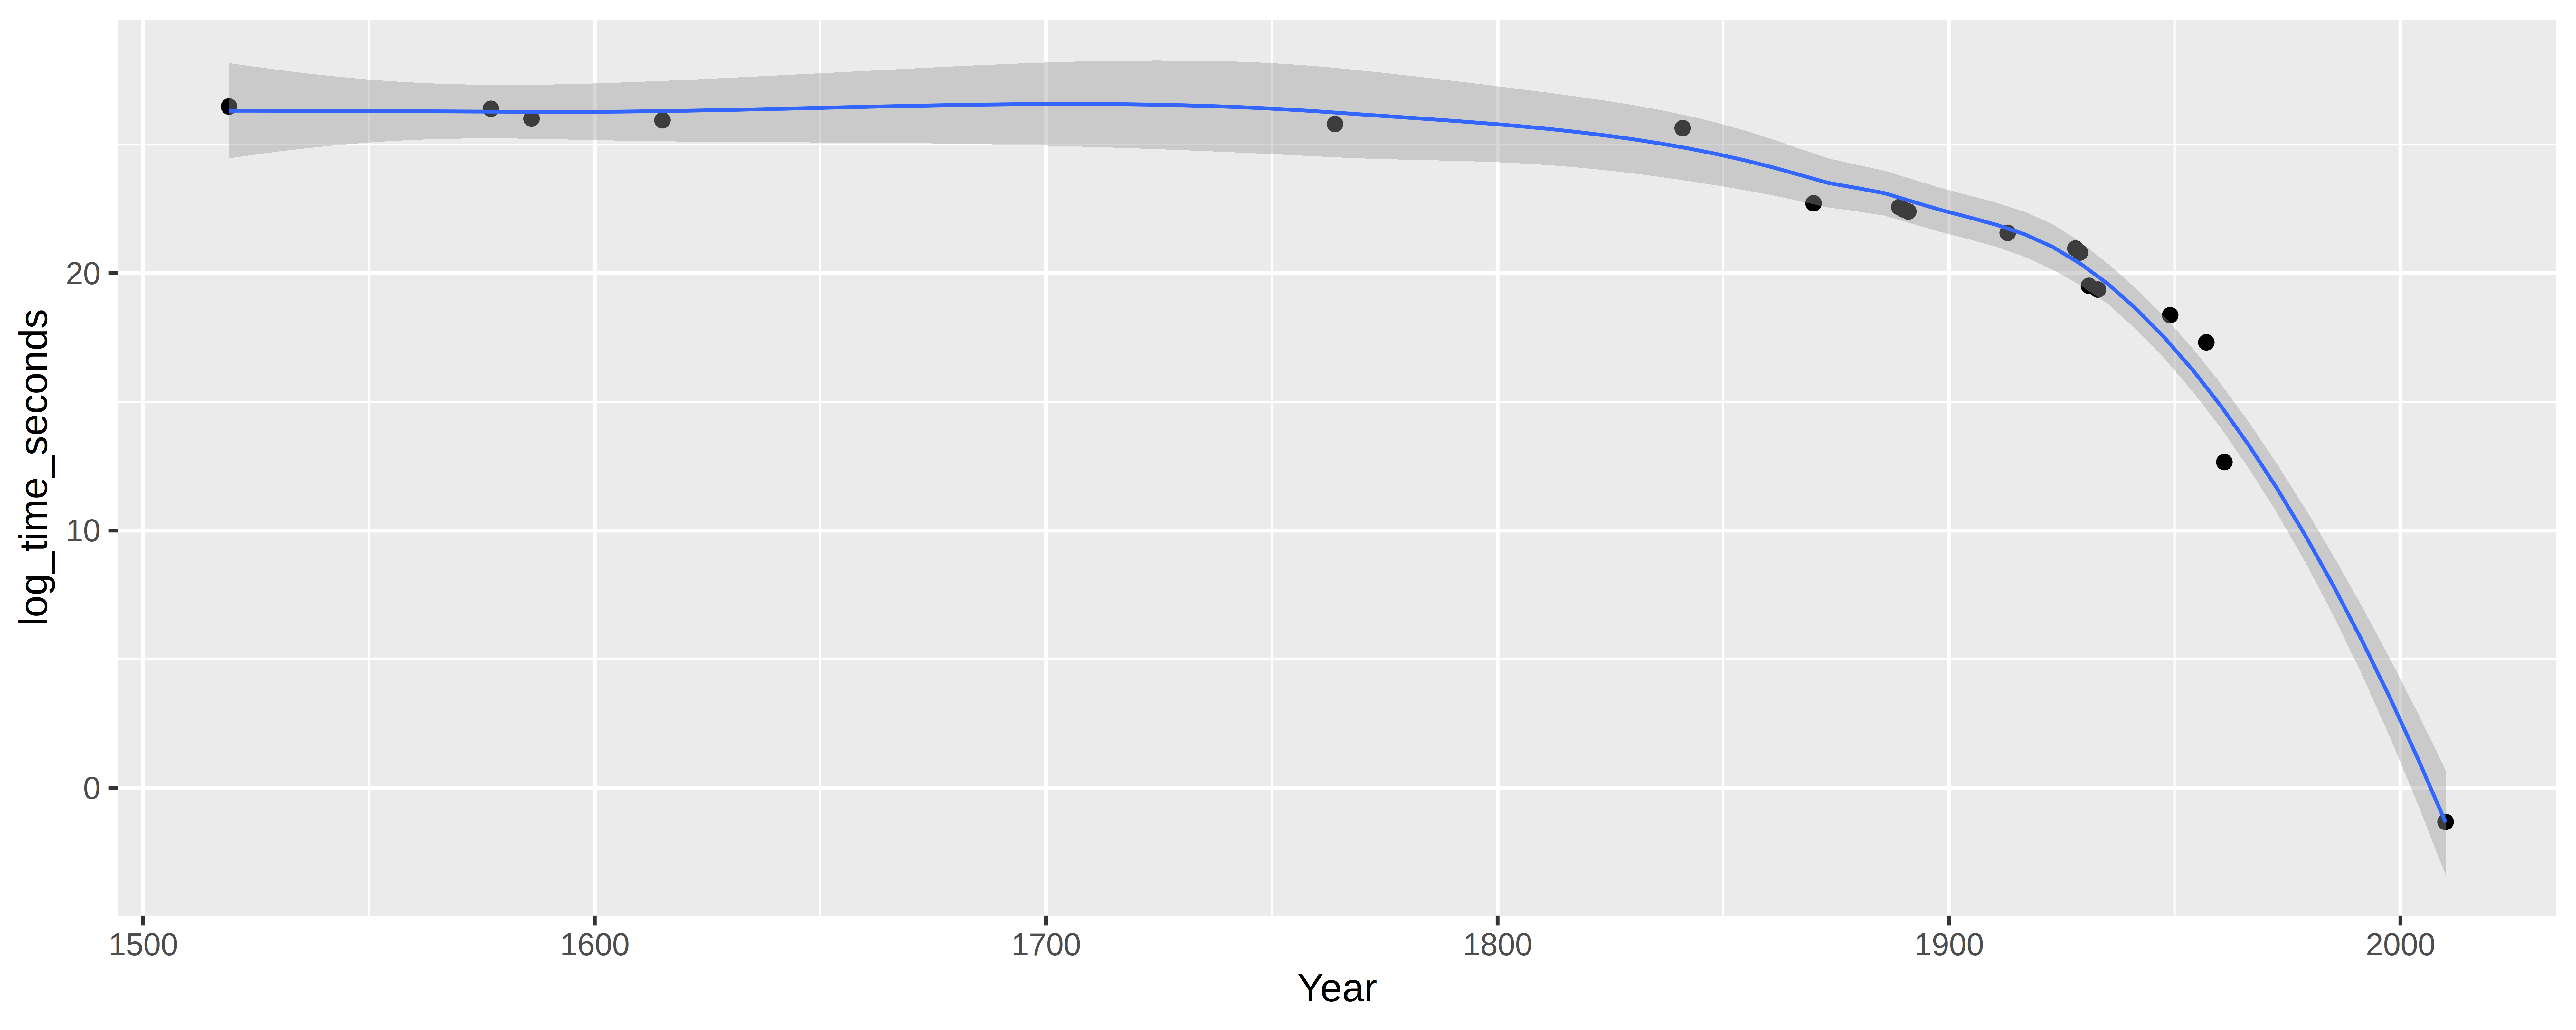
The rest become apparent if we plot the logarithm (base 2) of the time (in minutes).
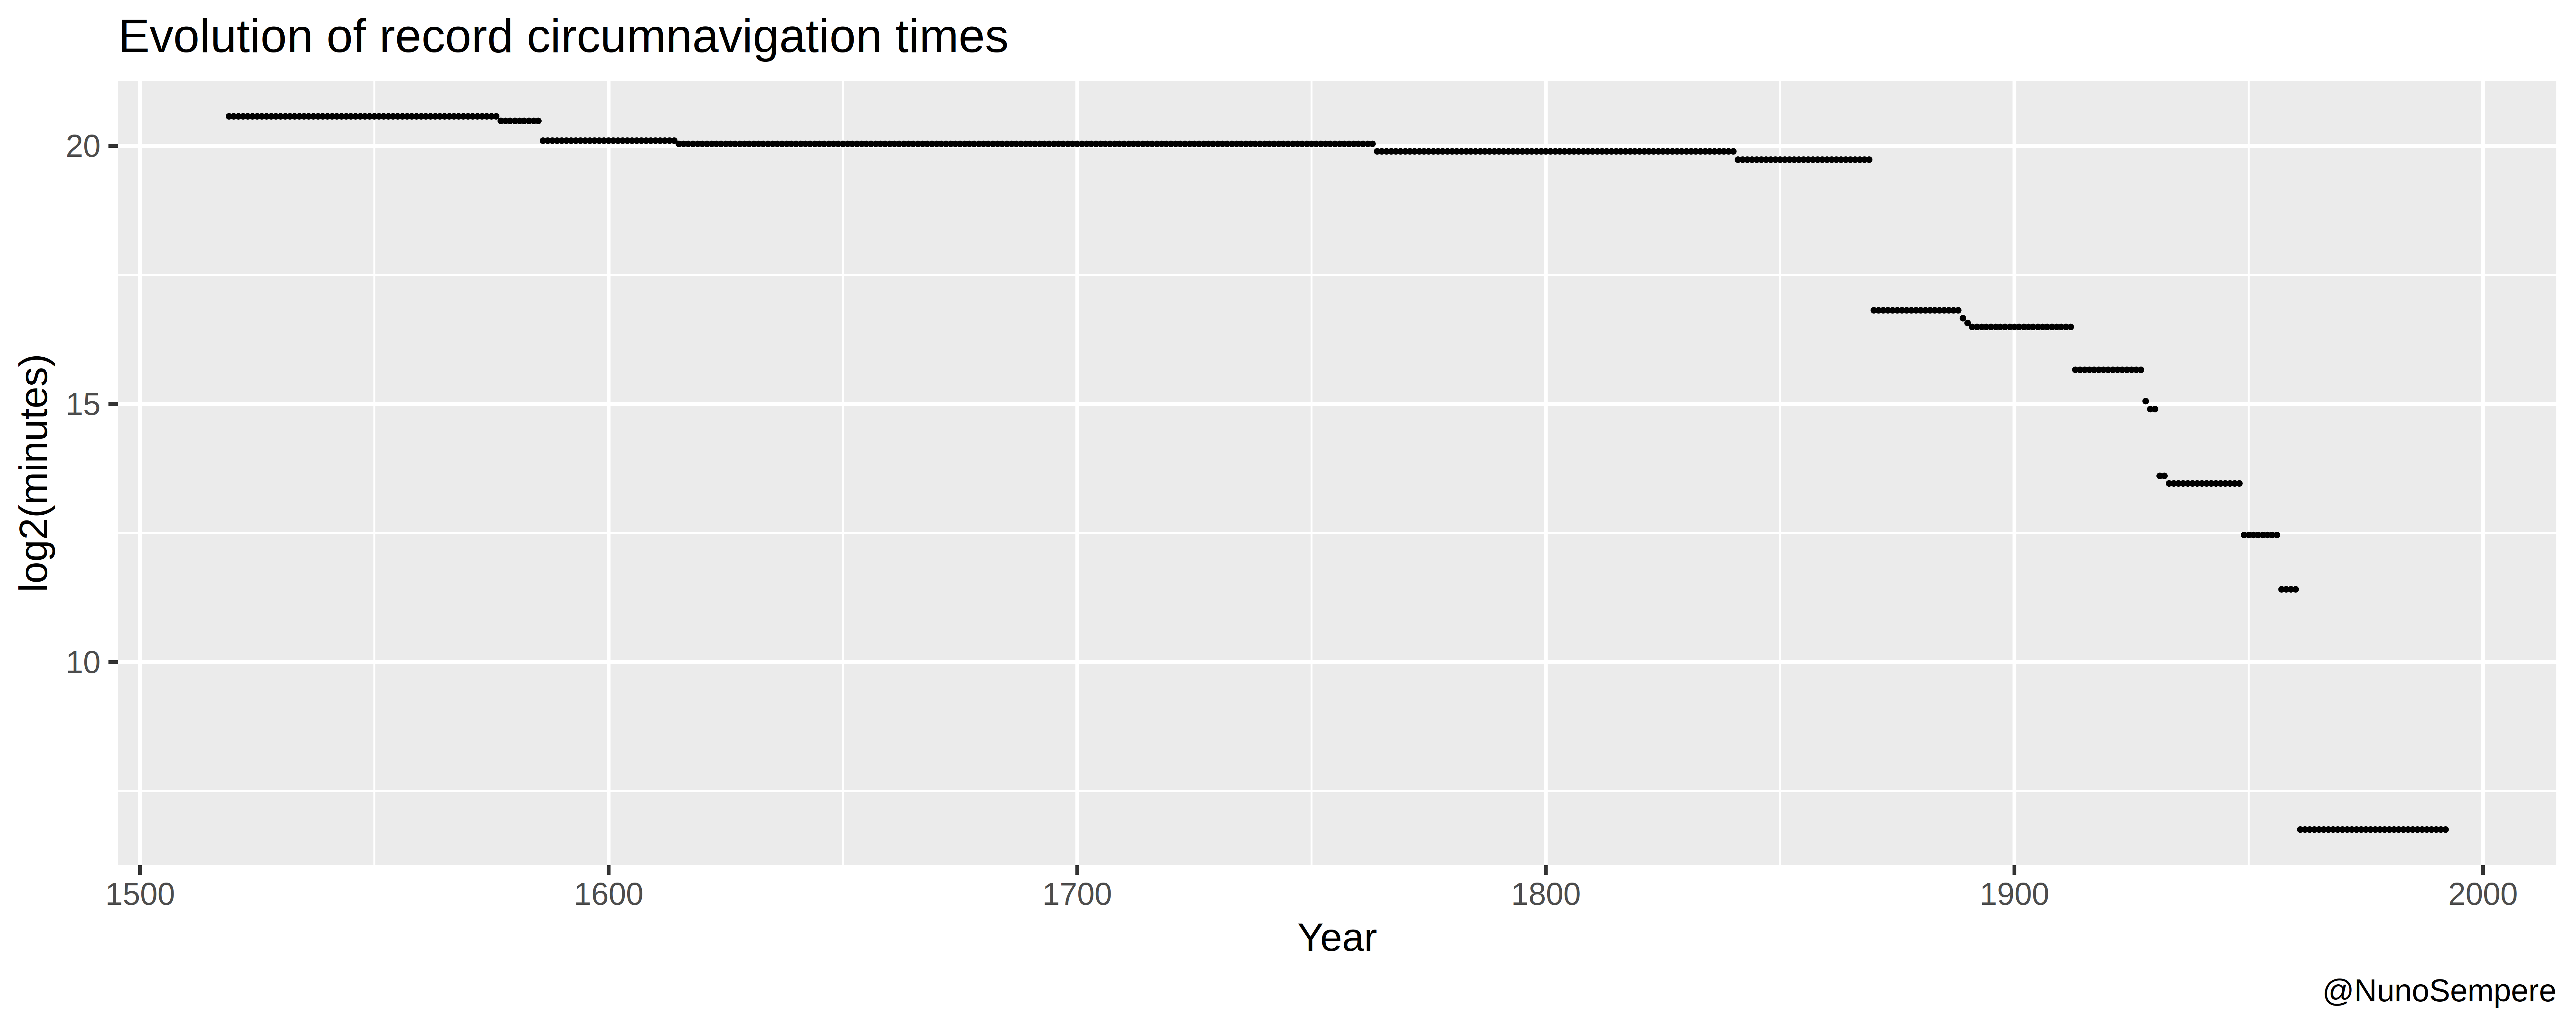
Here is the logarithm plot, with some smoothing applied:
Some of above in a table:
| Year | Rate of progress before | Discontinuity in terms of time of travel = New record - current record | How much extra time would have been needed? = (point - previous predicted point)/ previous rate of progress = (discontinuity - expected progress) / previous rate of progress |
|---|---|---|---|
| 1586 | 1.1034 days /year | 237 days | 203 years |
| 1870 | 0.69 days /year | 525 days | 740 years |
| 1931 | 1 day /year | 13 days | 11 years |
| 1961 | 6.1 hours /year | 31 hours | 1 year |
And here is that same table if we measure progress according to the logarithm (i.e., if halving the time needed is always equally impressive).
| Year | Rate of progress before | Discontinuity in terms of time of travel = New record - previous record | How much extra time would have been needed? = (point - previous predicted point) / previous rate of progress = (New record - previous record - predicted advance) / previous rate of progress |
|---|---|---|---|
| 1586 | 0.0015166 log2(days) /year | 0.3823431 log2(days) | 240 years |
| 1870 | 0.0014447 log2(days) /year | 2.9 log(days) | 1986 years |
| 1931 | 0.0327053 log2(days) /year | 1.39 log2(days) | 40.5 years |
| 1961 | 0.132842 log2(hours) /year | 4.18836 log2(hours) | 27.5 years |
Sources:
Wikipedia: List of circumnavigations
Wikipedia: Circumnavigation record progression
Data
Circumnavigation record progression (.csv)
Circumnavigation record progression, processed (.csv)
Also considered / under consideration:
- Saline solution for diarrhea, as opposed to previous treatments.
- Time to send a message across the Atlantic / around the Earth. For the circumnavigation case, I added an additional datapoint (time=0.4 seconds, year = 2010), corresponding to the time it takes for a message to go from New York to Australia and back. The resulting graph would be like so:
However, Wikipedia reveals that the first undersea cables were laid in 1858!
A transatlantic telegraph cable is an undersea cable running under the Atlantic Ocean used for telegraph communications. The first was laid across the floor of the Atlantic from Telegraph Field, Foilhommerum Bay, Valentia Island in western Ireland to Heart’s Content in eastern Newfoundland. The first communications occurred August 16, 1858, reducing the communication time between North America and Europe from ten days – the time it took to deliver a message by ship – to a matter of minutes. Transatlantic telegraph cables have been replaced by transatlantic telecommunications cables.
So the above addition is perhaps spurious, that is, given that transatlantic cables had already been laid, we’d expect that the time needed to send a message around the Earth would take less than an 108 minutes by 1961. Here, fluency with the historical record comes in handy: we know that was not the case:
The 1962 Cuban Missile Crisis made the hotline a priority. During the standoff, official diplomatic messages typically took six hours to deliver; unofficial channels, such as via television network correspondents, had to be used too as they were quicker.
…
During the [1962 Cuban Missile] crisis, the United States took nearly twelve hours to receive and decode Nikita Khrushchev’s 3,000-word initial settlement message – a dangerously long time. By the time Washington had drafted a reply, a tougher message from Moscow had been received, demanding that U.S. missiles be removed from Turkey. White House advisers thought faster communications could have averted the crisis, and resolved it quicker. The two countries signed the Hot Line Agreement in June 1963 – the first time they formally took action to cut the risk of starting a nuclear war unintentionally. - Source: Wikipedia
I wonder how an extension of the circumnavigation data with the time needed to send a message to a point’s antipode and back behaves. I might research this further.
- Discontinuities for yatch races (No discontinuities are apparent. I do not intend to research this further)
- Transatlantic sailing record / liner crossing times (No discontinuities 1833-1952. I do not intend to research this further).
- Cases in which a lone individual is causally responsible for discontinuous progress. Norman Borlaug.
Credit
The SS Great Eastern was brought to my attention in the “Bountied Rationality” Facebook group.